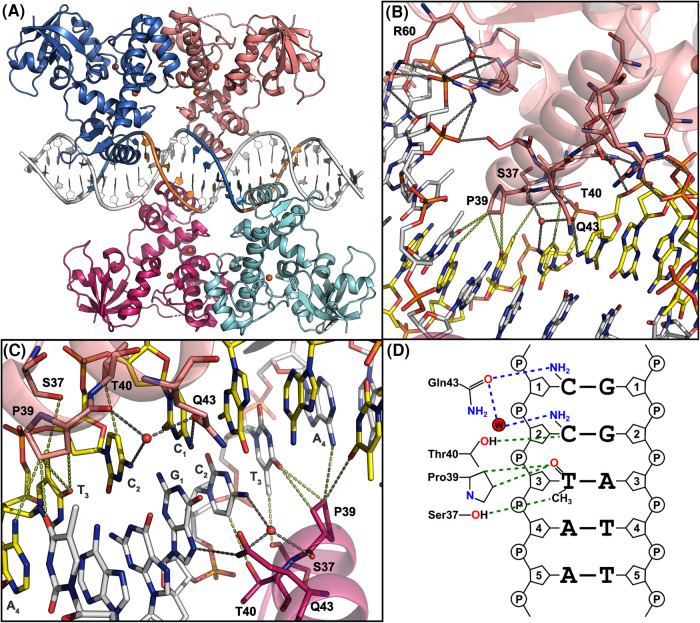
Figure 4. Interactions between IdeR and its DNA recognition sequence.
(A) Overall structure of Fe2+-activated SeIdeR in complex with its consensus DNA-binding sequence (PDB 7B20) [11]. IdeR is colored by subunit. The Fe2+ ions are shown as orange spheres. The CCTAA repeats in the DNA contacted by each IdeR subunit are shown in blue and orange. (B) Interactions between SeIdeR and the consensus DNA recognition sequence shown in detail, illustrating how the recognition helix is anchored to the DNA. Only residues mentioned in the text are labeled. (C) Interactions between SeIdeR and DNA bases, focused on the central G-C basepair in the consensus recognition sequence. In (B,C), hydrogen bonds and salt bridges are indicated by dashed gray lines, vdW interactions (distances between 3.3 and 3.7 Å) by dashed green lines. (D) Two-dimensional representation of the specific interactions between IdeR and DNA bases in the consensus DNA recognition sequence. Hydrogen bonds are shown as dashed blue lines, vdW interactions as dashed green lines. This figure was adapted from [11]. (A–C) were prepared with PyMOL (Schrödinger, LLC).

