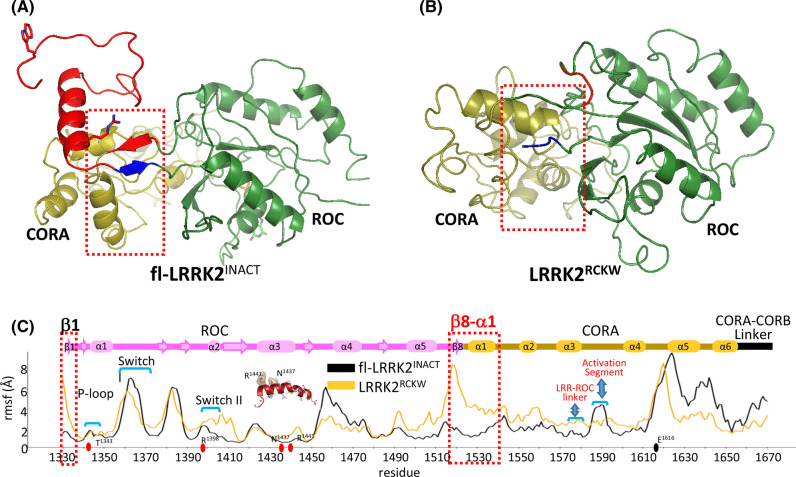
Figure 4. Gaussian MD Simulations of the ROC:COR domains in fl-LRRK2 and LRRK2RCKW.
The GaMD representative structures of fl-LRRK2INACT (top left) and LRRK2RCKW (top right) are shown. Only fl-LRRK2INACT includes the LRR–ROC linker motif, colored in red. The ROC and COR-A domains are colored in green and gold, respectively. In the RMSF analysis (bottom), LRRK2RCKW shows higher RMSF for β1 and β8 of ROC domain and the first helix in CORA domain compared with fl-LRRK2INACT. The figure highlights switch I, switch II, P-loop, and α3ROC helix in the ROC domain, as well as regions in the CORA domain that interact with the LRR–COR linker and the Activation Segment.

