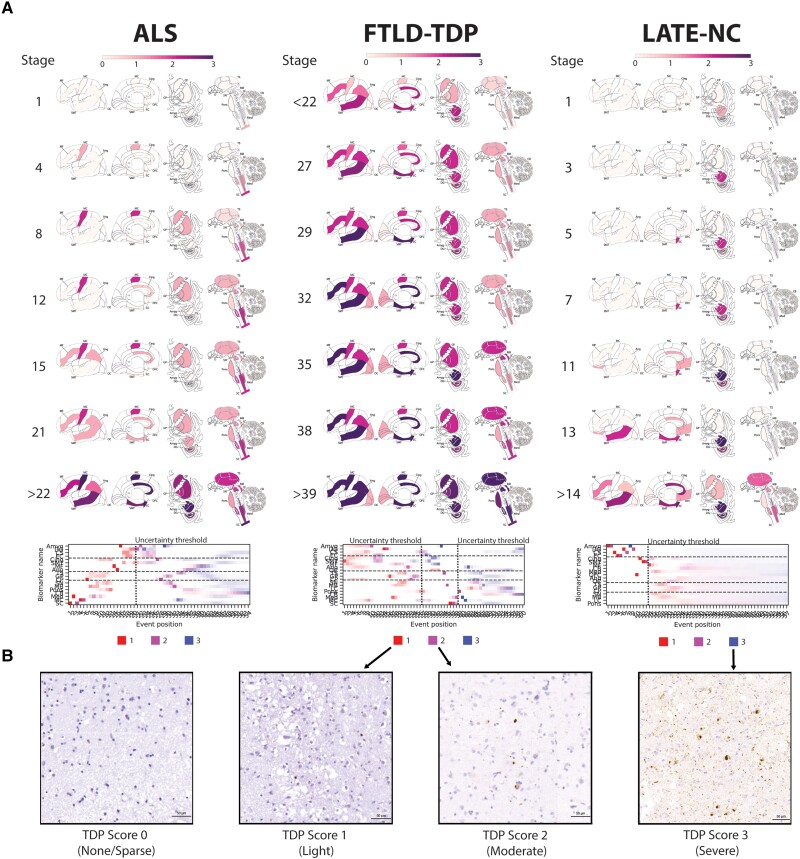
Figure 1.
Progression patterns of TDP-43 proteinopathies. (A) Inferred trajectory of regional TDP-43 progression based on individuals with a primary pathological diagnosis of ALS (left), a primary pathological diagnosis of FTLD-TDP (middle), or a secondary or tertiary pathological diagnosis of LATE-NC. Colours within each brain region represent the cumulative sum of probabilities (0–1) summed across three stages of severity, light pathology (1) in red, moderate pathology (2) in purple and severe pathology (3) in blue (see key at the bottom of each column). Only stages with reduced event ordering uncertainty (e.g. those represented by at least five individual donors) are shown. Brain schematics were generated using: https://github.com/AllenInstitute/hba_brain_schematic. Below the brains are positional variance diagrams. Each box represents the degree of certainty that a given brain region (y-axis) has reached a given severity stage (red, light; purple, moderate; blue, severe) at a given SuStaIn stage (x-axis). (B) Representative micrographs for TDP-43 scores of 0, 1, 2 and 3, respectively. ALS = amyotrophic lateral sclerosis; Amyg = amygdala; Ang = angular gyrus; CB = cerebellum; Cing = anterior cingulate; CP = caudate/putamen; CS = CA1/subiculum; DG = dentate gyrus; EC = entorhinal cortex; FTLD-TDP = frontotemporal lobar degeneration due to TDP-43; GP = globus pallidus; LATE-NC = limbic-predominant age-related TDP-43 encephalopathy neuropathologic change; LC = locus coeruleus; MB = midbrain; MC = motor cortex; MF = middle frontal gyrus; Med = medulla; OC = occipital cortex; OFC = orbitofrontal cortex; SC = spinal cord; SMT = superior and middle temporal gyrus; SN = substantia nigra; TS = thalamus.

