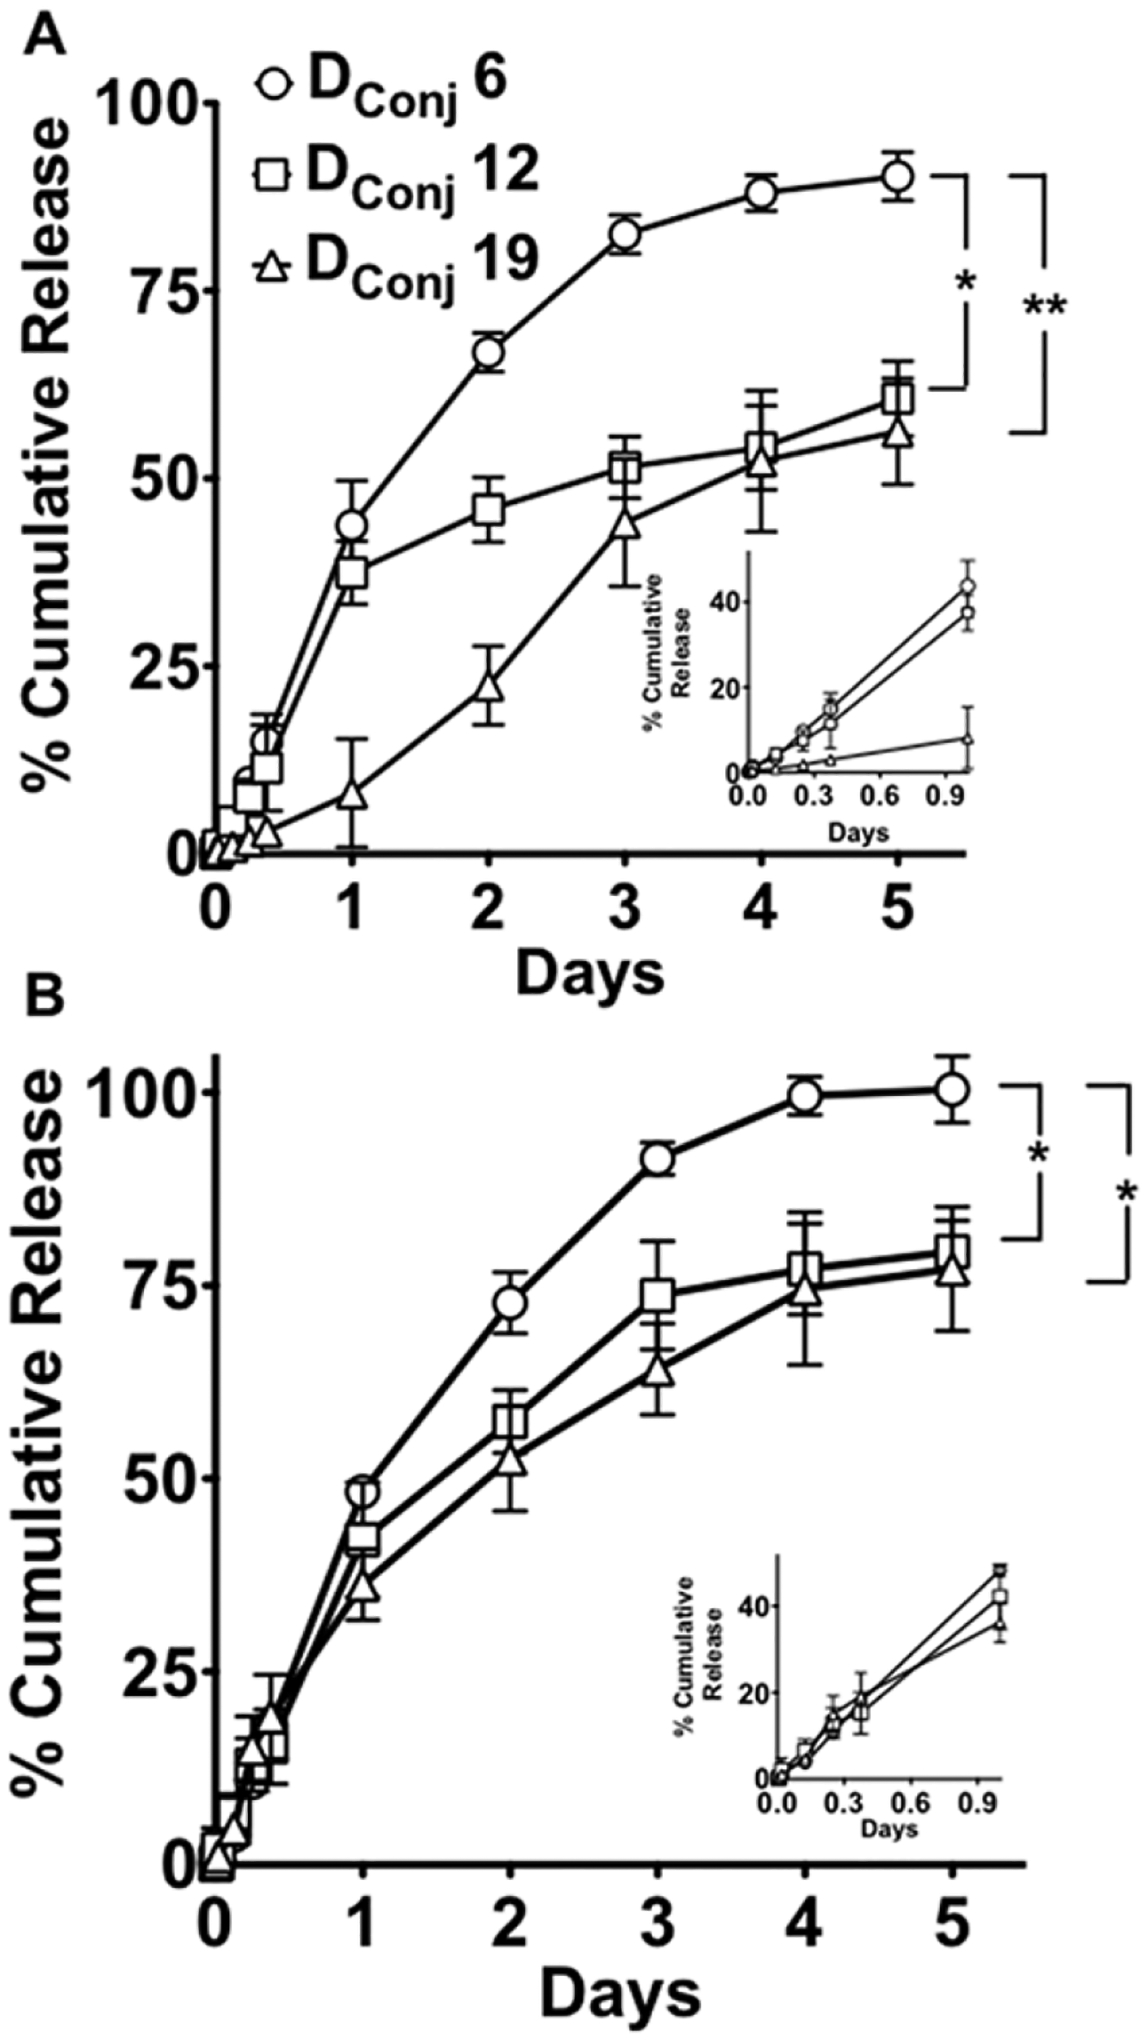
Figure 6.

Release of cisplatin from Pt-A6-MNC, Pt-A12-MNC and Pt-A19-MNC-1 at (A) pH 7.4 and (B) pH 5.5. Data are mean ± SD (n = 3); statistical analysis performed by ANOVA using SPSS statistical software, *p < 0.05; **p < 0.01. The graphs in the insets of both the plots show the release patterns in the first 24 h.
