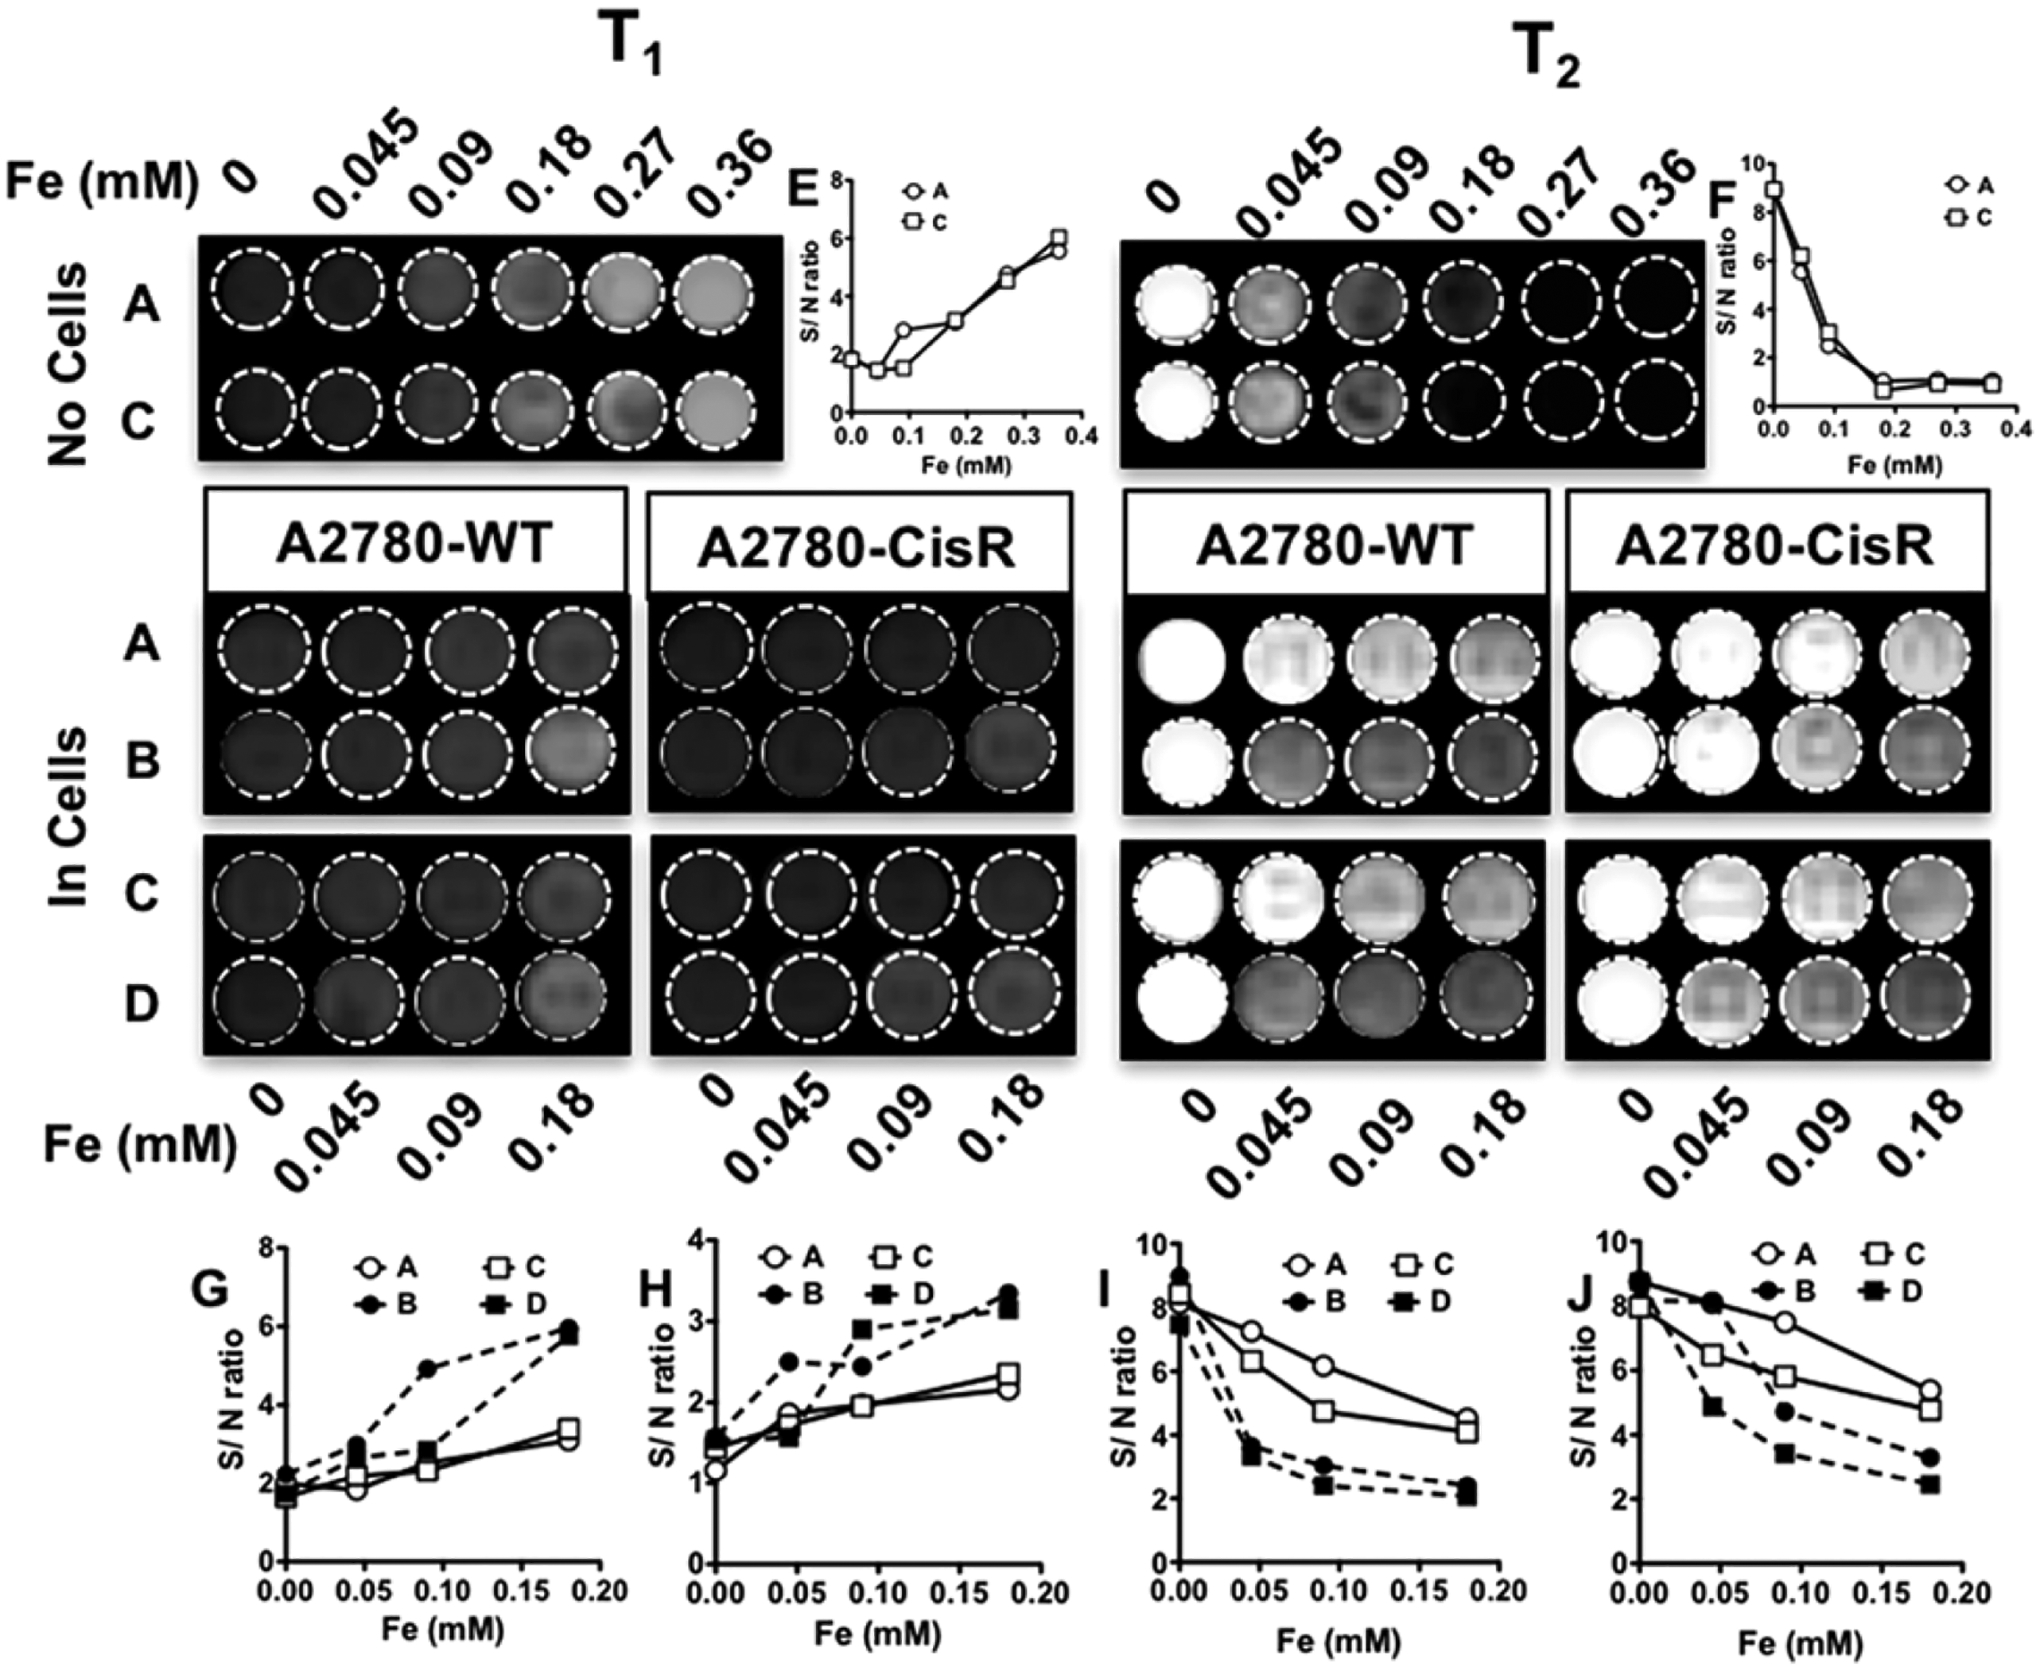
Figure 9.

In vitro evaluation of MRI potential of different formulations. T1 and T2 images of phantom gels of A2780-WT and A2780-CisR cells incubated with different concentrations of (A) A19-MNC-1, (B) LH-A19-MNC-1, (C) Pt-A19-MNC-1, and (D) LH-Pt-A19-MNC-1. The image contrasts are compared with those obtained from serial dilutions of A19-MNC-1 and Pt-A19-MNC-1 in the absence of cells (top). The signal-to-noise (S/N) ratios for the different sets of contrasts were plotted against the corresponding Fe concentrations to quantitatively compare the contrasts obtained by the four different formulations A–D. The comparisons of S/N ratios of T1 and T2-weighted contrasts of formulations A and C in phantoms with no cells are represented in parts E and F respectively. parts G and I represent the S/N ratios of T1 and T2-weighted contrasts in phantoms of A2870-WT cells while parts H and J represent the same of A2780-CisR cells incubated with different concentrations of formulations A–D.
