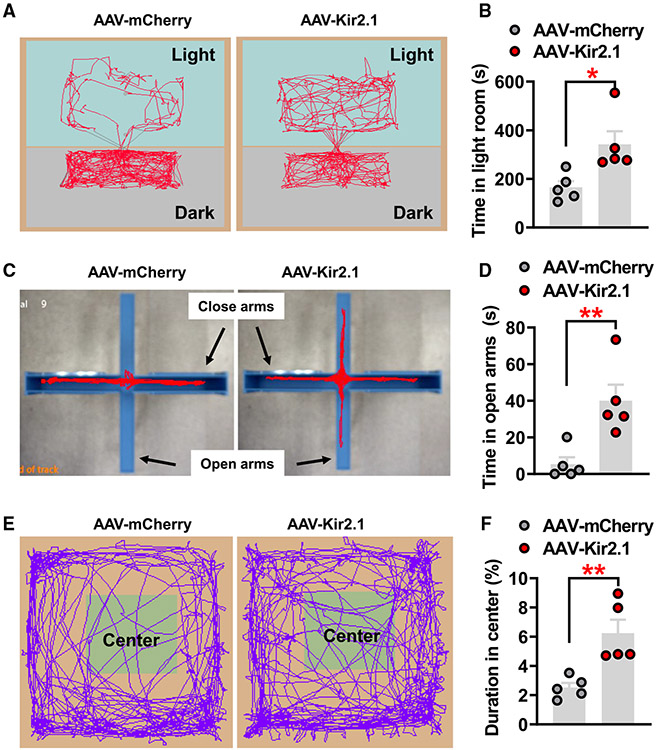
Figure 5. Chronic inhibition of PVH-projected LSv neurons leads to behavioral signs of reduced anxiety level.
(A and B) Representative movement traces of LDT in control-injected (mCherry) and Kir2.1-injected mice (n = 5 mice/each group) (A), and statistical comparison between these two groups (B, paired t test, *p < 0.05).
(C and D) Representative movement traces of EPM tests in control and Kir2.1 mice (C) and statistical comparison between these two groups (D, paired t test, **p < 0.01).
(E and F) Representative movement traces of OFT in control and Kir2.1 mice (E) and statistical comparison between these two groups (F, paired t test, **p < 0.01).
All data presented as mean ± SEM.

