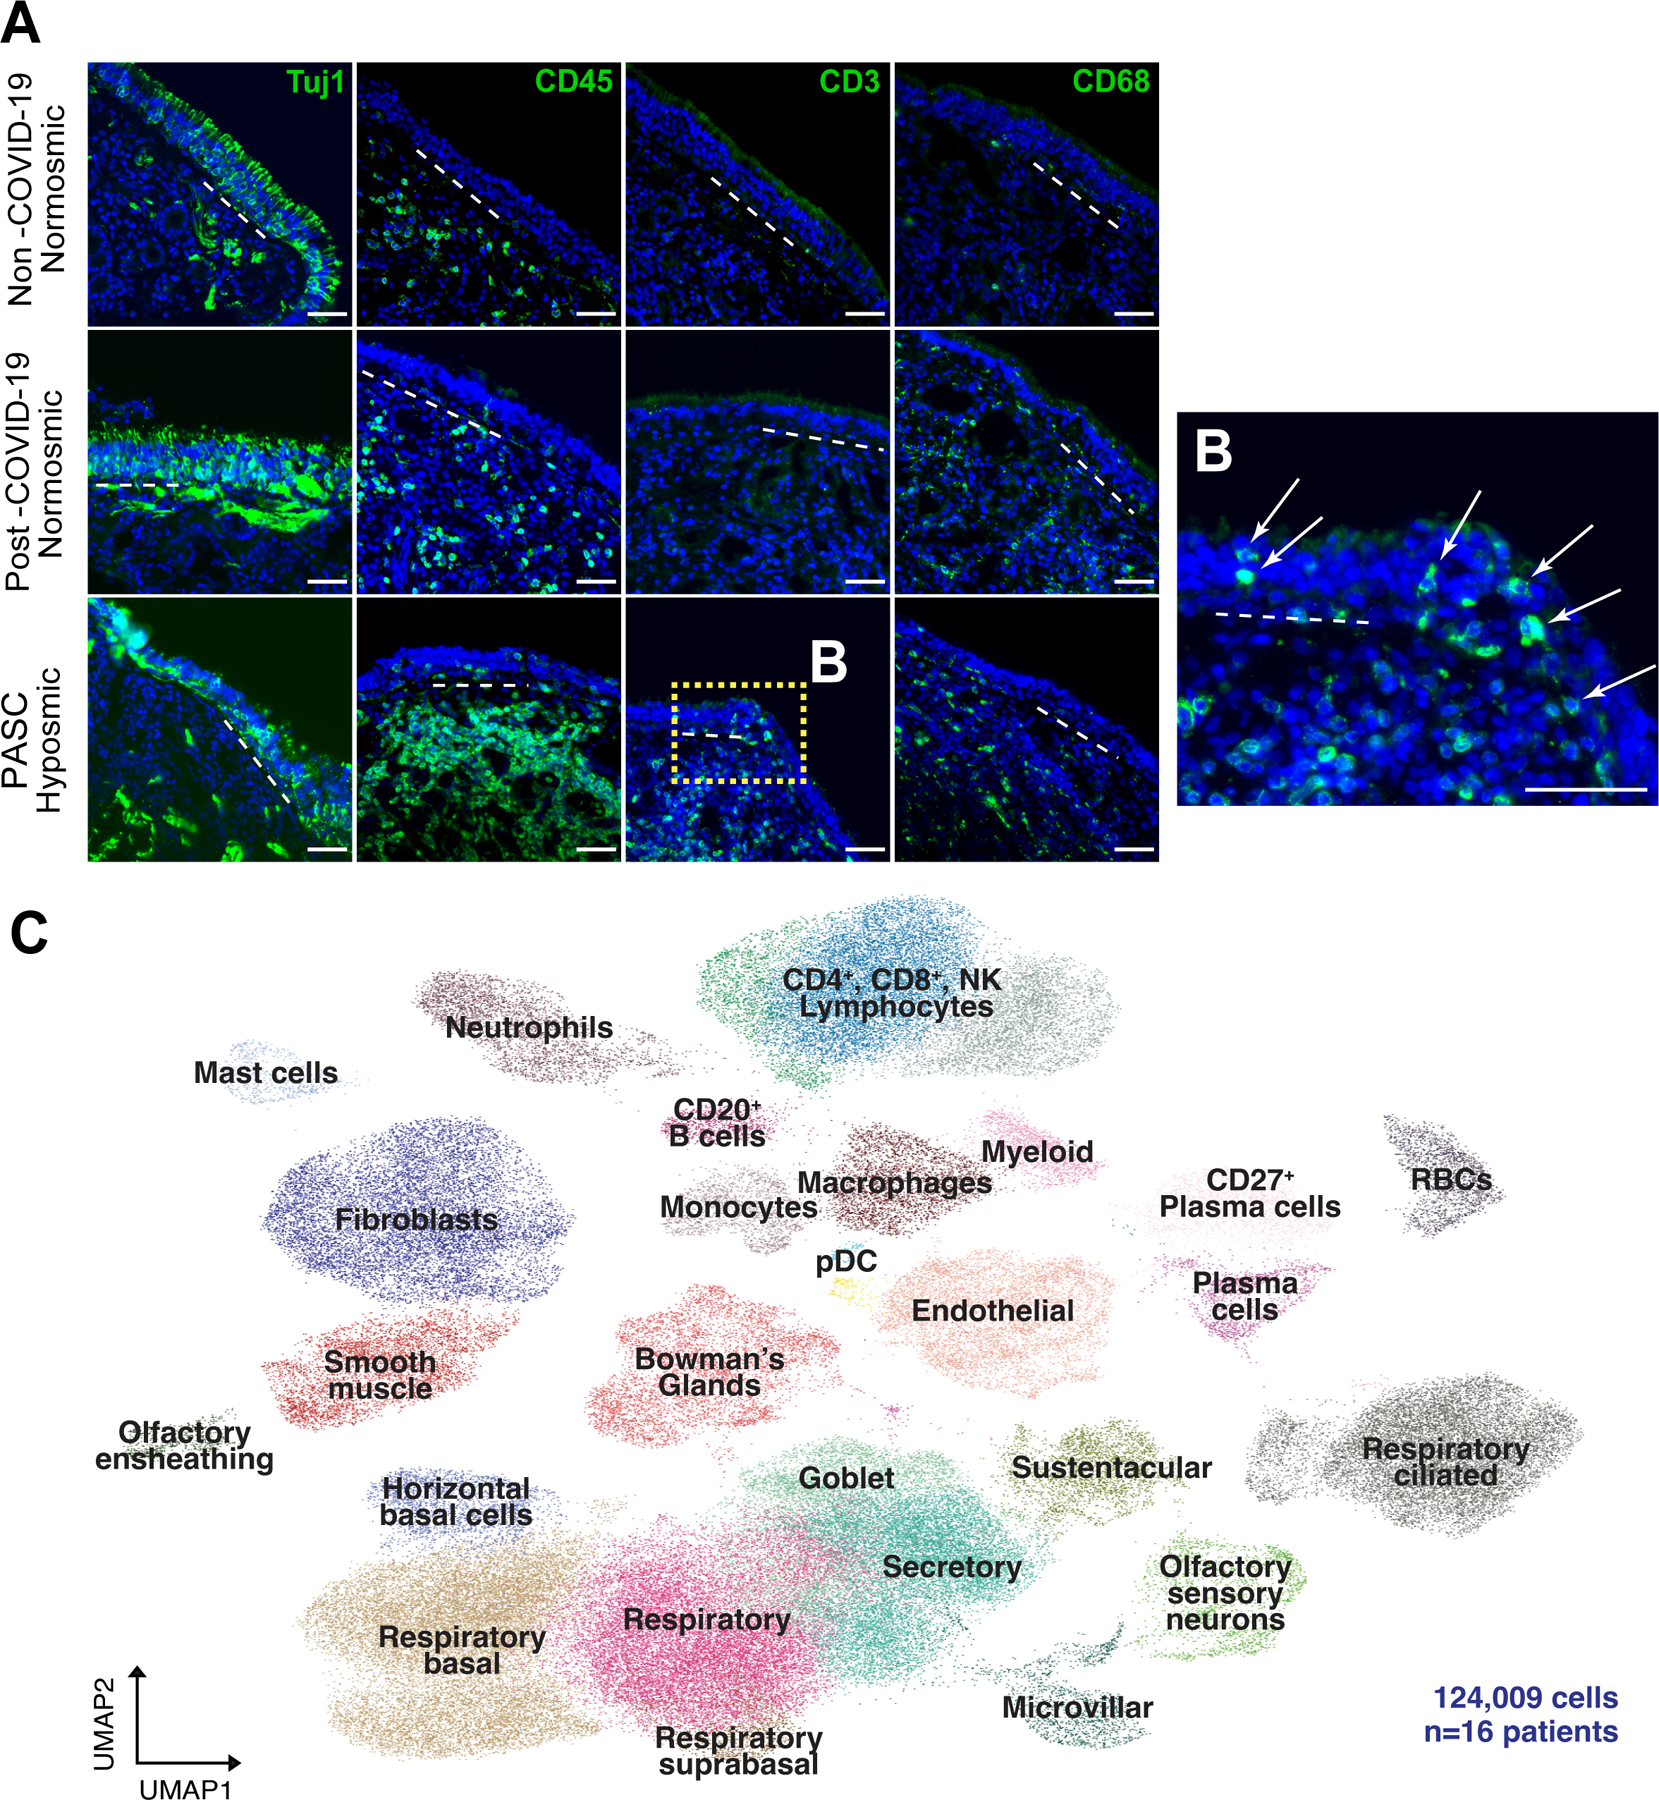
Fig. 1. T cell infiltrates in olfactory epithelium of nasal biopsies from PASC hyposmic patients.

(A) Shown are representative immunohistochemistry images of nasal biopsy tissue from normosmic non-COVID-19, normosmic post-COVID-19 or PASC hyposmic individuals. Tissue sections were immunostained for the TUJ1 neuronal marker, CD45 pan-immune cell marker, CD3 T cell marker and CD68 myeloid cell marker. PASC hyposmic tissue showed dense CD45+ immune cell infiltration including prominent CD3+ lymphocytic infiltration, which was absent in the normosmic groups; scattered CD68+ cells were present in all conditions. (B) Enlarged area (dashed yellow box) shows CD3+ lymphocytes, with prominent epithelial infiltration (arrows); dashed white lines mark the basal lamina. Scale bar, 50 μm. (C) Because of these observations, additional biopsies were processed for scRNA-seq to permit quantitative analyses; uniform manifold approximation projection (UMAP) visualization of combined PASC hyposmic and control normosmic scRNA-seq datasets integrating n=16 human nasal biopsies permitted robust cell cluster analysis and annotation. Red blood cells (RBCs), plasmacytoid dendritic cell (pDC).
