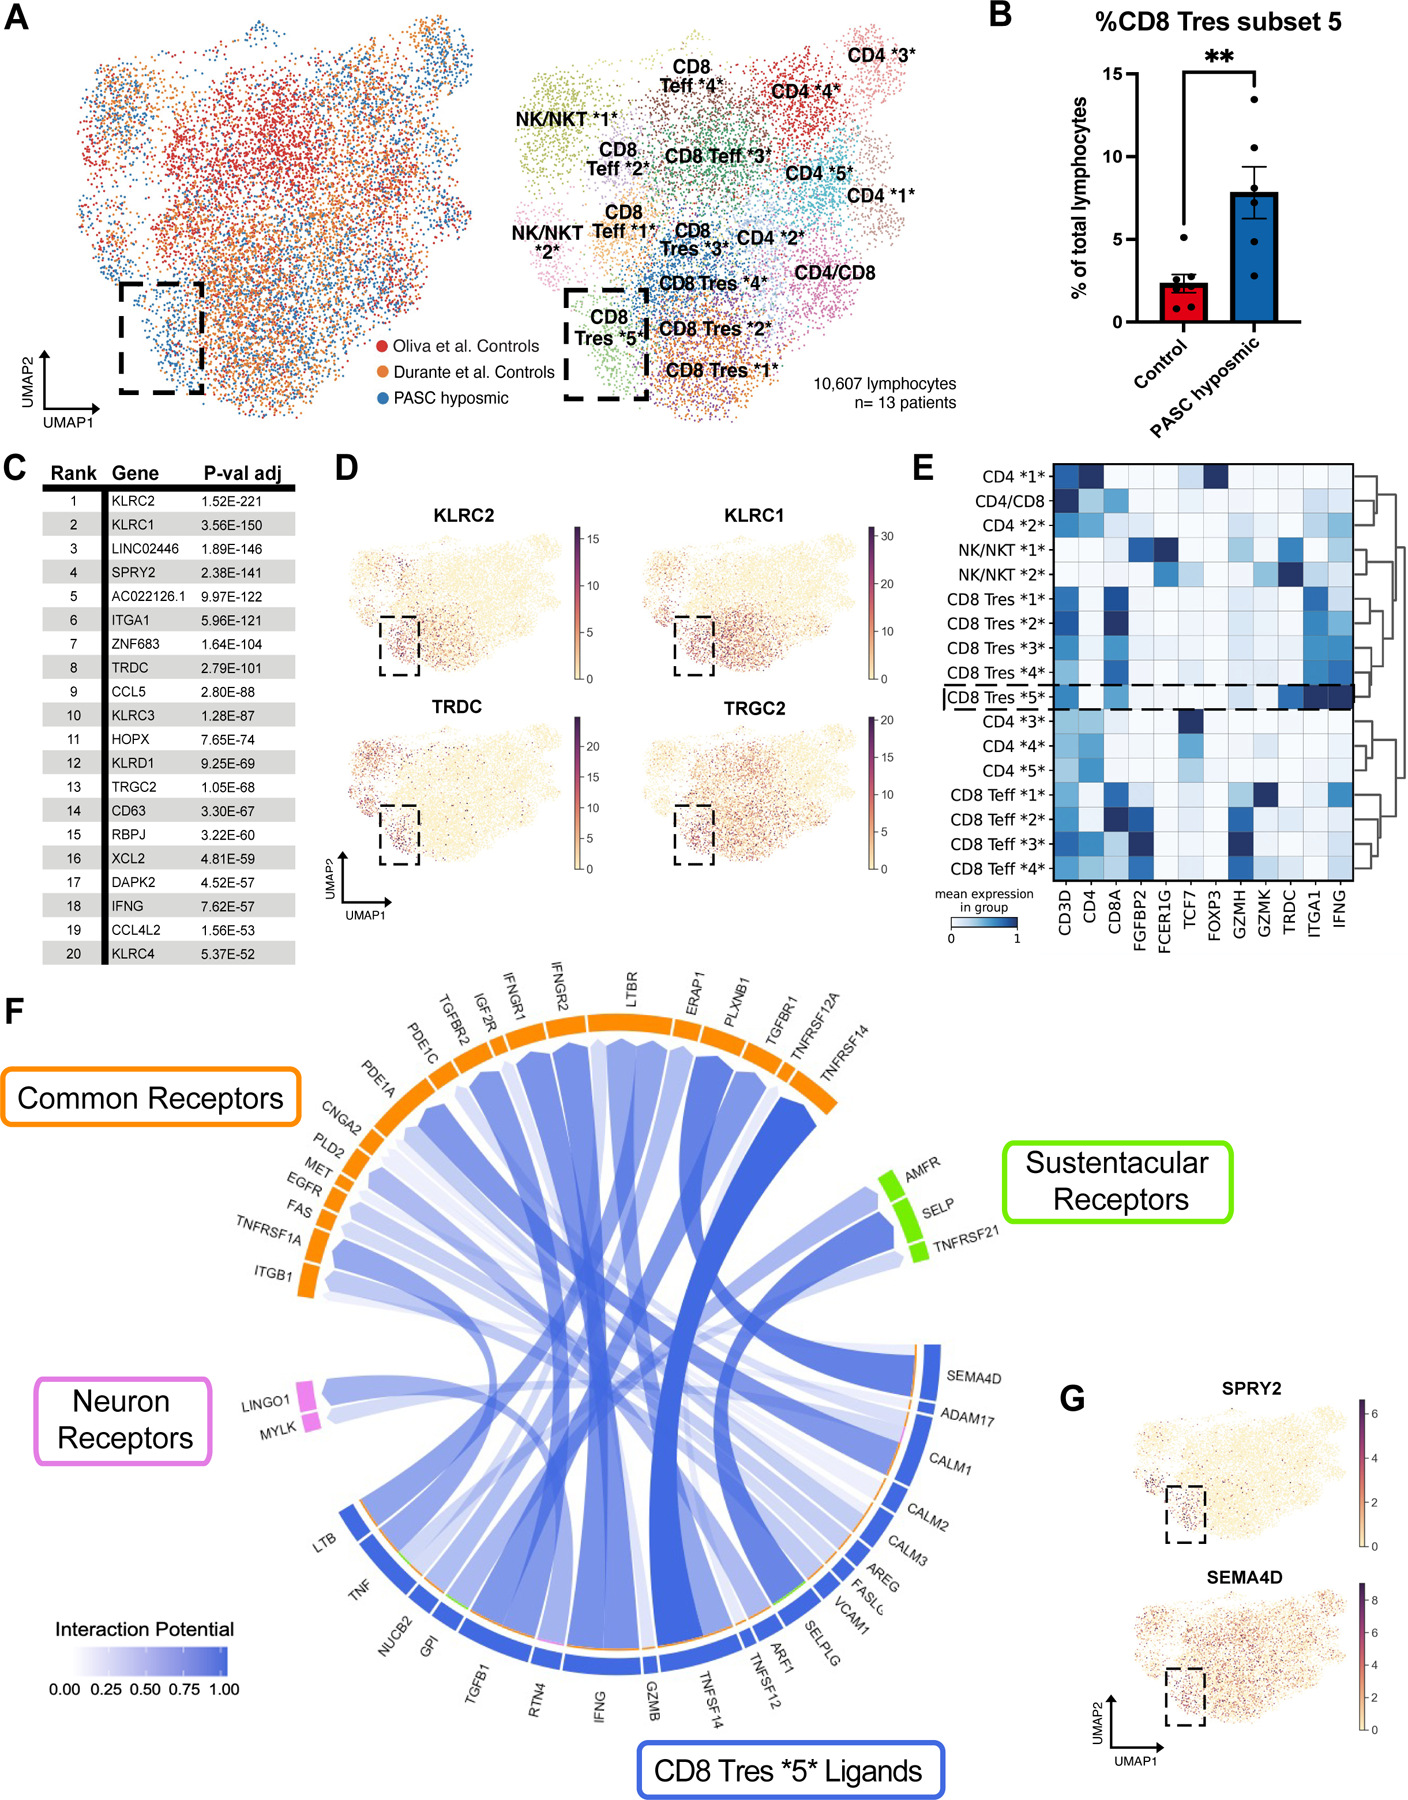
Fig. 2. A CD8+ T cell subset is enriched in PASC hyposmic nasal biopsies.

(A) UMAP visualization of all lymphocytes from CD8+, CD4+, and NK/NKT cell clusters from olfactory biopsy scRNA-seq data, comparing PASC hyposmic samples to 2 available normosmic control samples; “Oliva et al Controls” (19) were normosmic by Smell Identification Test scores, while the “Durante et al Controls” (9) were normosmic by subjective report. Black box denotes clusters enriched in PASC hyposmic samples. Teff, effector T cells; Tres, resident T cells; subsets within categories are designated by numbers (i.e. CD4 *1* thru CD4 *5*). (B) PASC hyposmic biopsies show enrichment for cell cluster CD8 Tres subset 5, compared to both control datasets (two-tailed t-test, P=0.0015). (C) Top ranked transcripts enriched in CD8 Tres subset 5 cluster (by adjusted P-value, Wilcoxon Rank-sum test, with Bonferroni correction). (D) Selected gene expression plots of significantly enriched genes in the PASC hyposmic-specific cluster CD8 Tres subset 5 (black box), including γδ T cell markers and associated genes (TRDC, TRGC2, KLRC1, KLRC2). (E) Selected gene expression and dendrogram clustering among lymphocyte subsets confirming annotations based on published marker genes. The IFNG gene is enriched in Tres subsets, especially the CD8 Tres subset 5. (F) Circos plot showing NicheNet analysis of CD8 Tres-derived ligands and their receptors in either sustentacular cells or olfactory sensory neurons, depicting interaction potential. Common receptors in orange are present in both sustentacular cells and neurons. (G) Additional plots confirm PASC hyposmic γδ T cells express T cell ligands identified by differential gene expression (SPRY2) or NicheNet analysis (SEMA4D).
