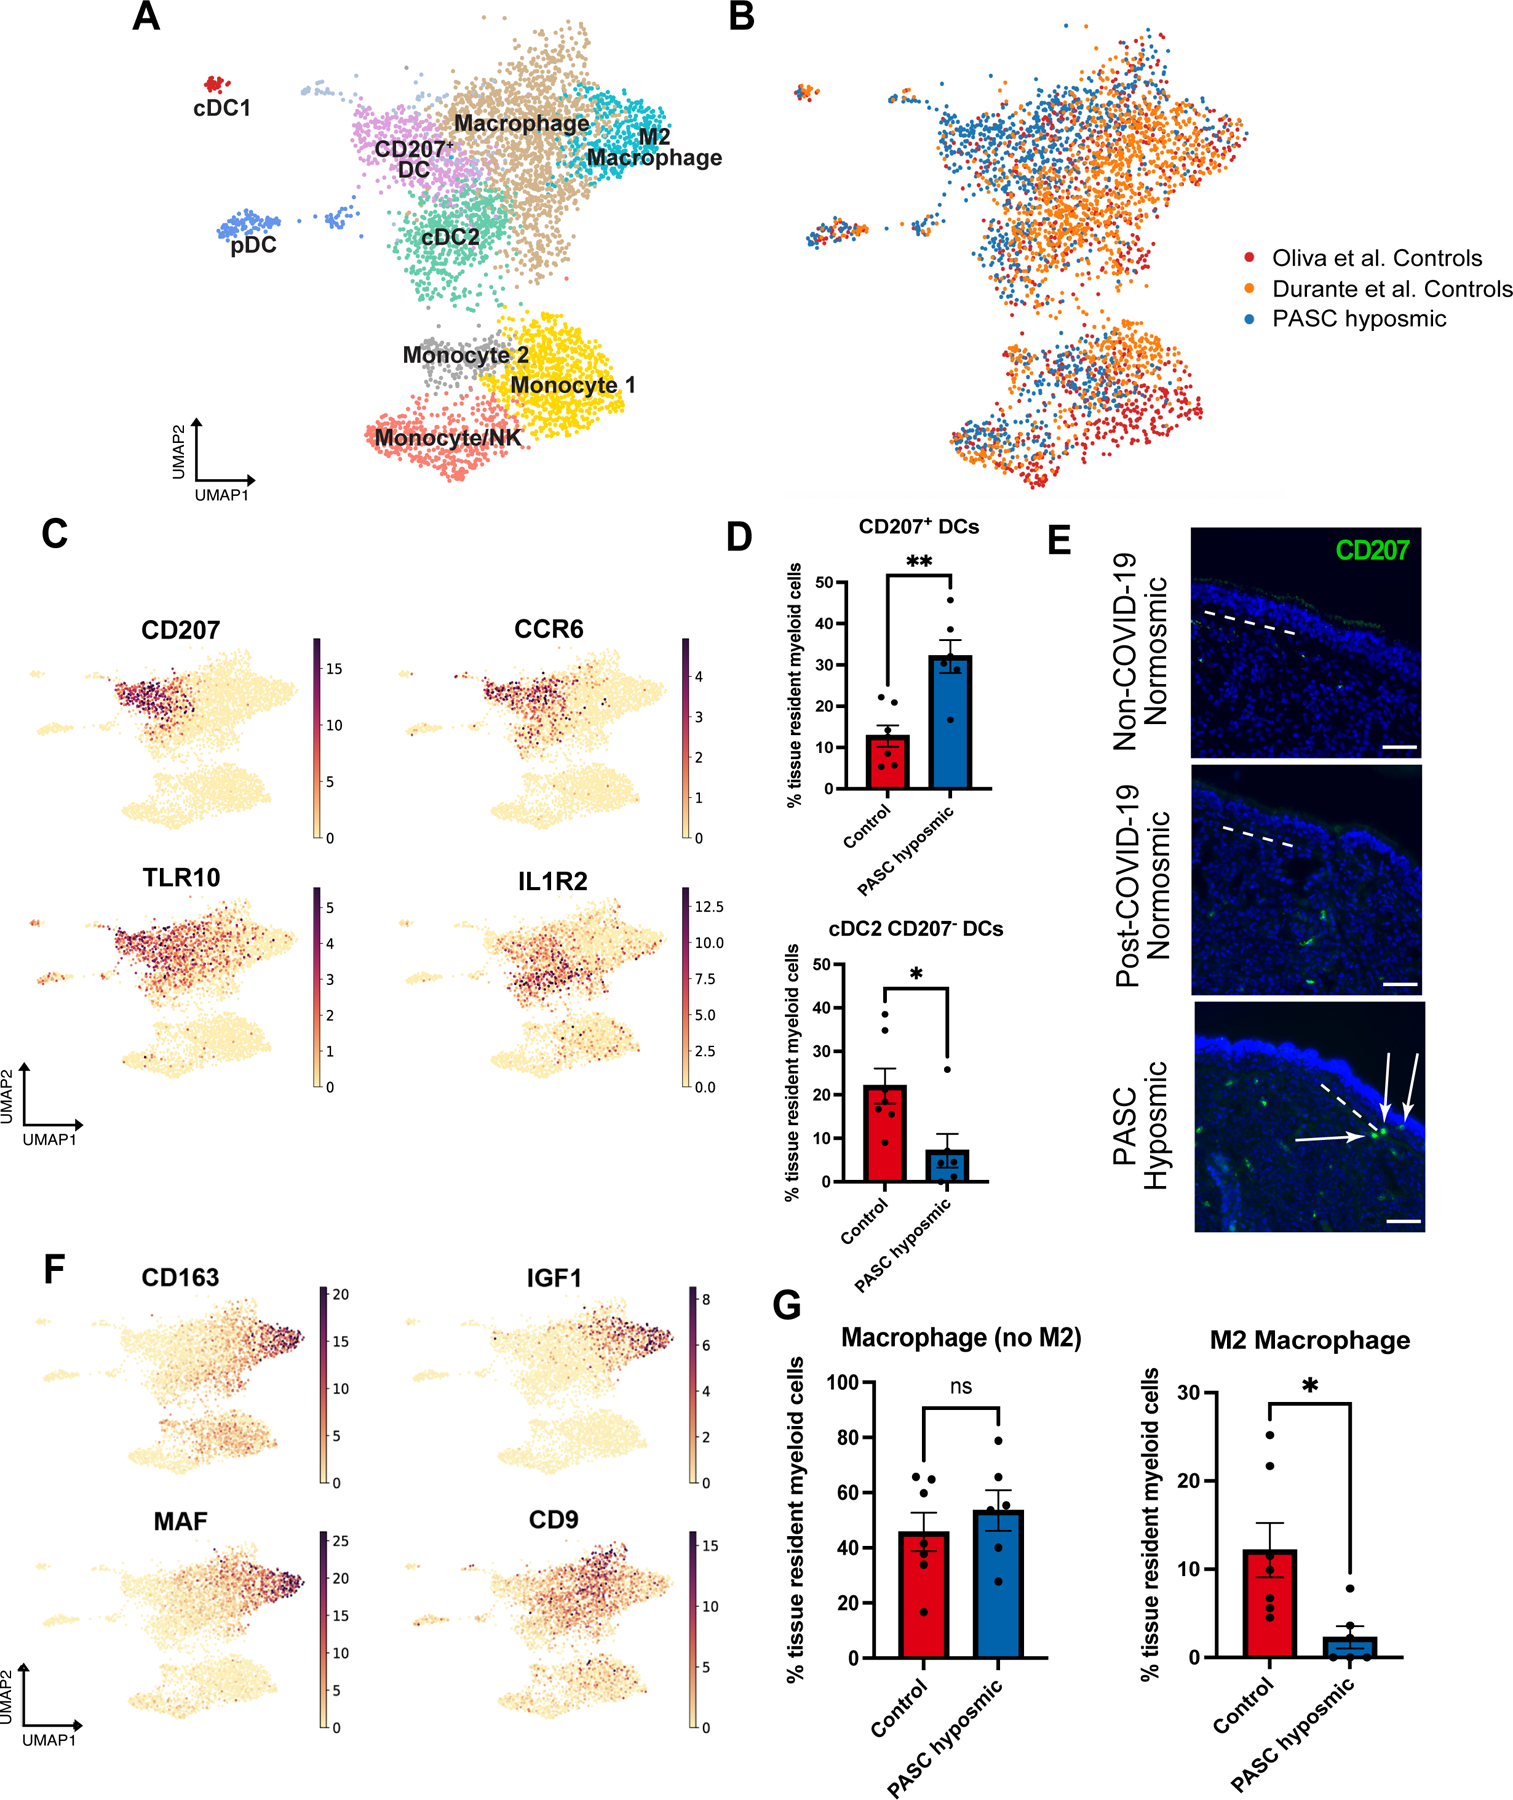
Fig. 3. PASC hyposmic olfactory samples show a myeloid cell shift with enriched dendritic cell subsets and decreased M2 macrophages.

(A) UMAP visualization of olfactory biopsy scRNA-seq data for selected myeloid cell clusters, comparing PASC hyposmic to both normosmic control data sets. DC, dendritic cells; pDC, plasmacytoid dendritic cells (CLEC4C+); cDC1, conventional DC type 1 cells (CLEC9A+); cDC2, conventional DC type 2 cells (CLEC10A+). (B) UMAP plots in panel A, colored by sample contribution. (C) Selected gene expression plots confirm cluster annotation for CD207+ dendritic cells and additional marker genes obtained by differential gene expression analysis for the CD207+ dendritic cell cluster (CCR6 and TLR10) and the cDC2 cluster (IL1R2). (D) CD207+ dendritic cells (DCs) are enriched in PASC hyposmic biopsies (blue) compared to normosmic control (non-COVID-19) biopsies (red) (two-tailed t-test, P=0.0016; CD207− DCs are reduced, P=0.0236). (E) Anti-CD207 antibody staining confirmed CD207+ dendritic cells in PASC hyposmic nasal biopsies (white arrows); dashed white lines mark the basal lamina. Scale bar, 50 μm. (F) Gene expression plots indicate marker genes for M2 macrophage (CD163, MAF, IGF1) and total macrophage (CD9) clusters. (G) PASC hyposmic biopsies showed depletion of M2 macrophages relative to all resident myeloid cells (two-tailed t-test, P=0.0175).
