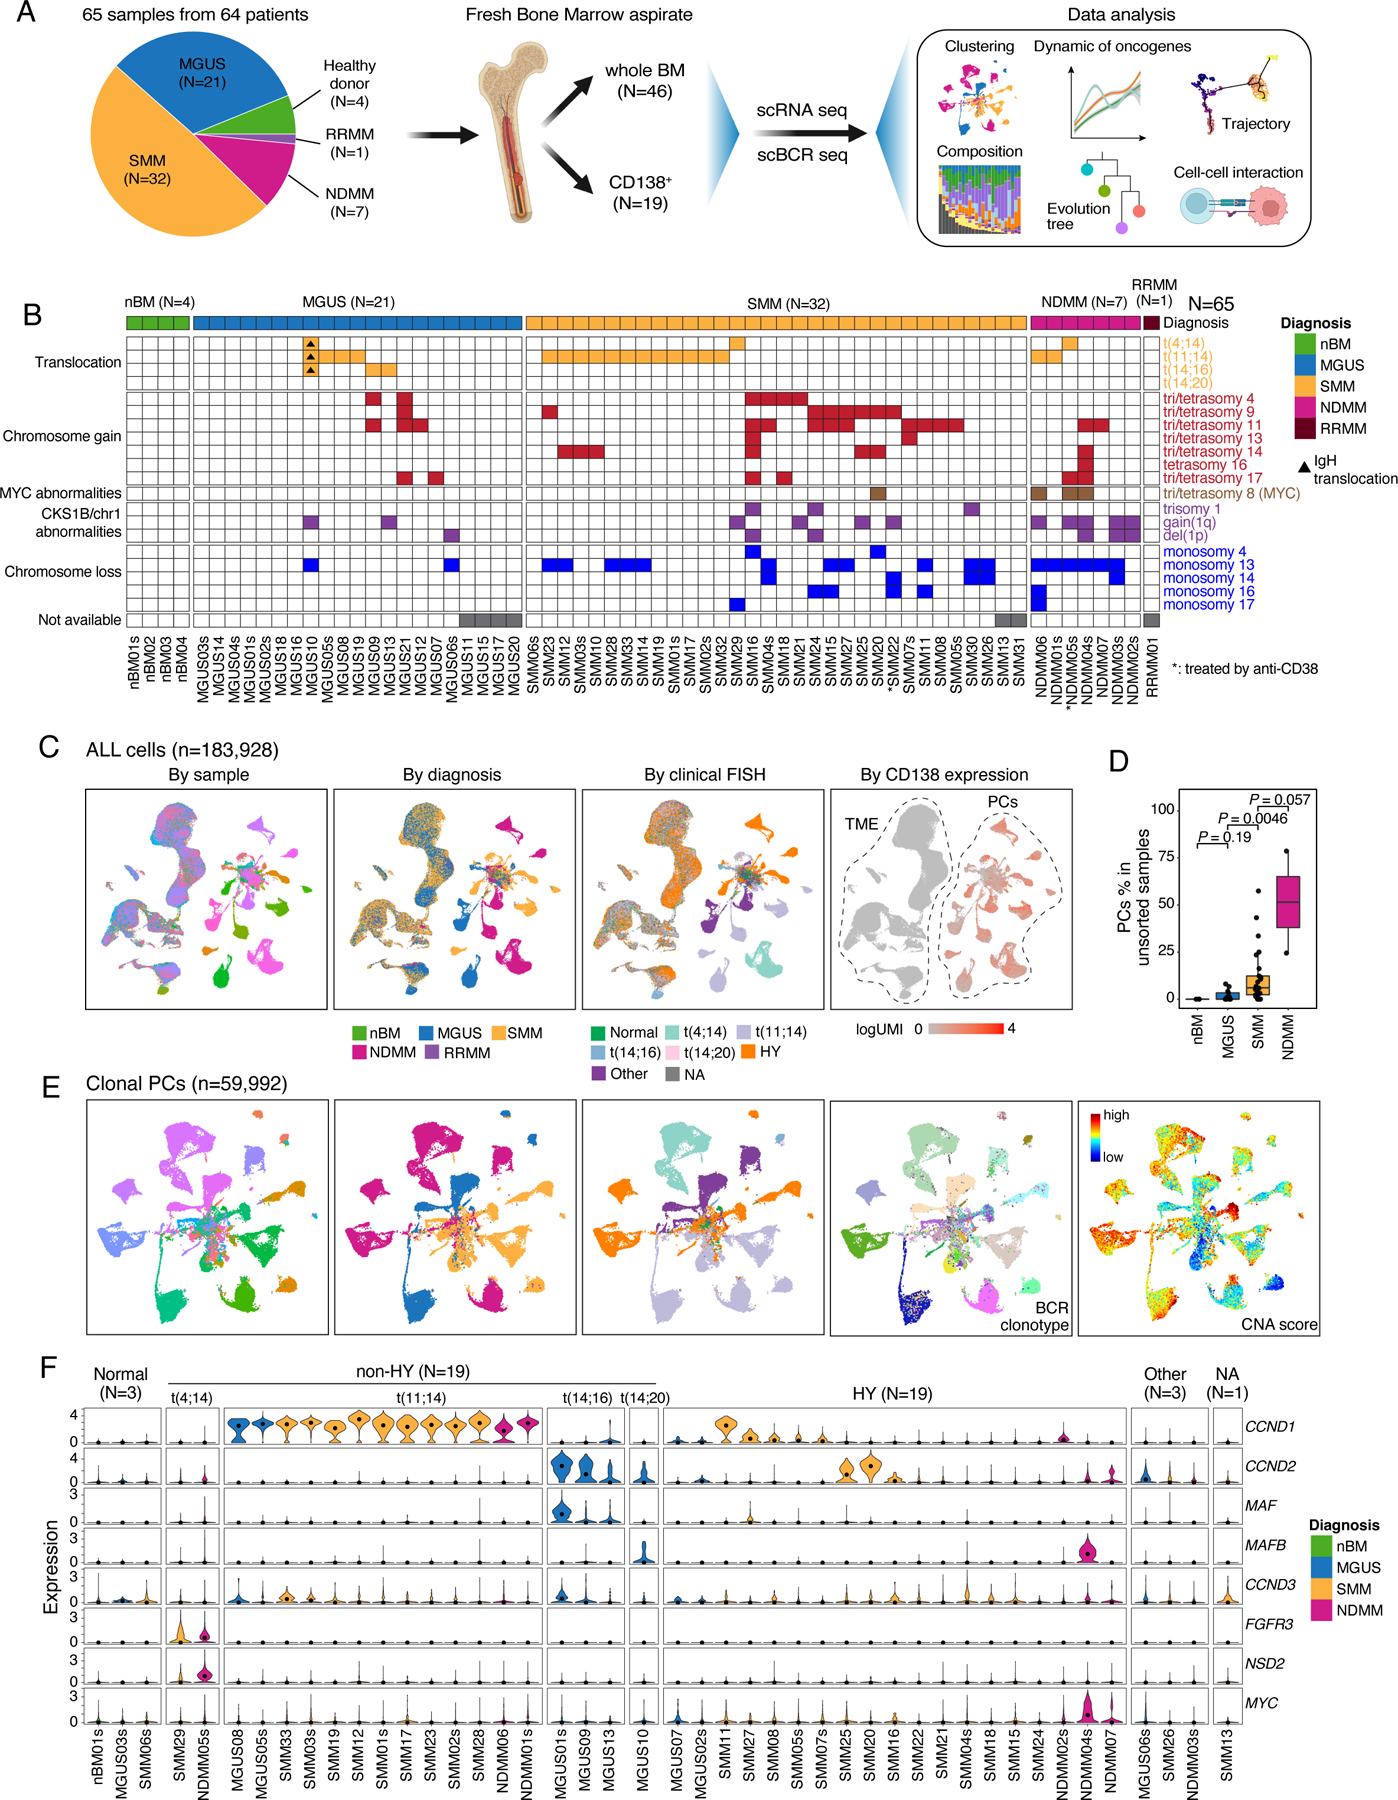
Figure 1. Workflow, sample information and single cell transcriptome map of this study.

(A) A schema depicting the workflow of this study. (B) fluorescence in situ hybridization (FISH) results of 65 samples in this study. Samples were grouped by their diagnosis. (C) Uniform manifold approximation and projection (UMAP) visualization of unsupervised clustering analysis of all cells except erythrocytes (n = 183,928) that passed quality filtering. Cells were color coded for CD138 expression level (left), diagnosis (middle) and cytogenetic abnormalities determined by FISH (right). (D) Boxplots showing the comparisons of PC proportions in unsorted samples between nBM (N=3), MGUS (N=13), SMM (N=25) and NDMM (N=2). (E) UMAP visualization of unsupervised clustering analysis of all cPCs (n = 59,992) from 44 samples with ≥ 49 cPCs. Cells were color coded (from left to right) for their corresponding patient origins, diagnosis, cytogenetic abnormalities, BCR clonotypes and inferred CNA score. (F) Violin plots showing expression of translocation related genes in cPCs in 44 patients with ≥ 49 cPCs and nPCs in 1 healthy donor. Samples were grouped by their cytogenetic abnormalities and color coded by diagnosis. See also Figures S1, S2, Tables S1–S3.
