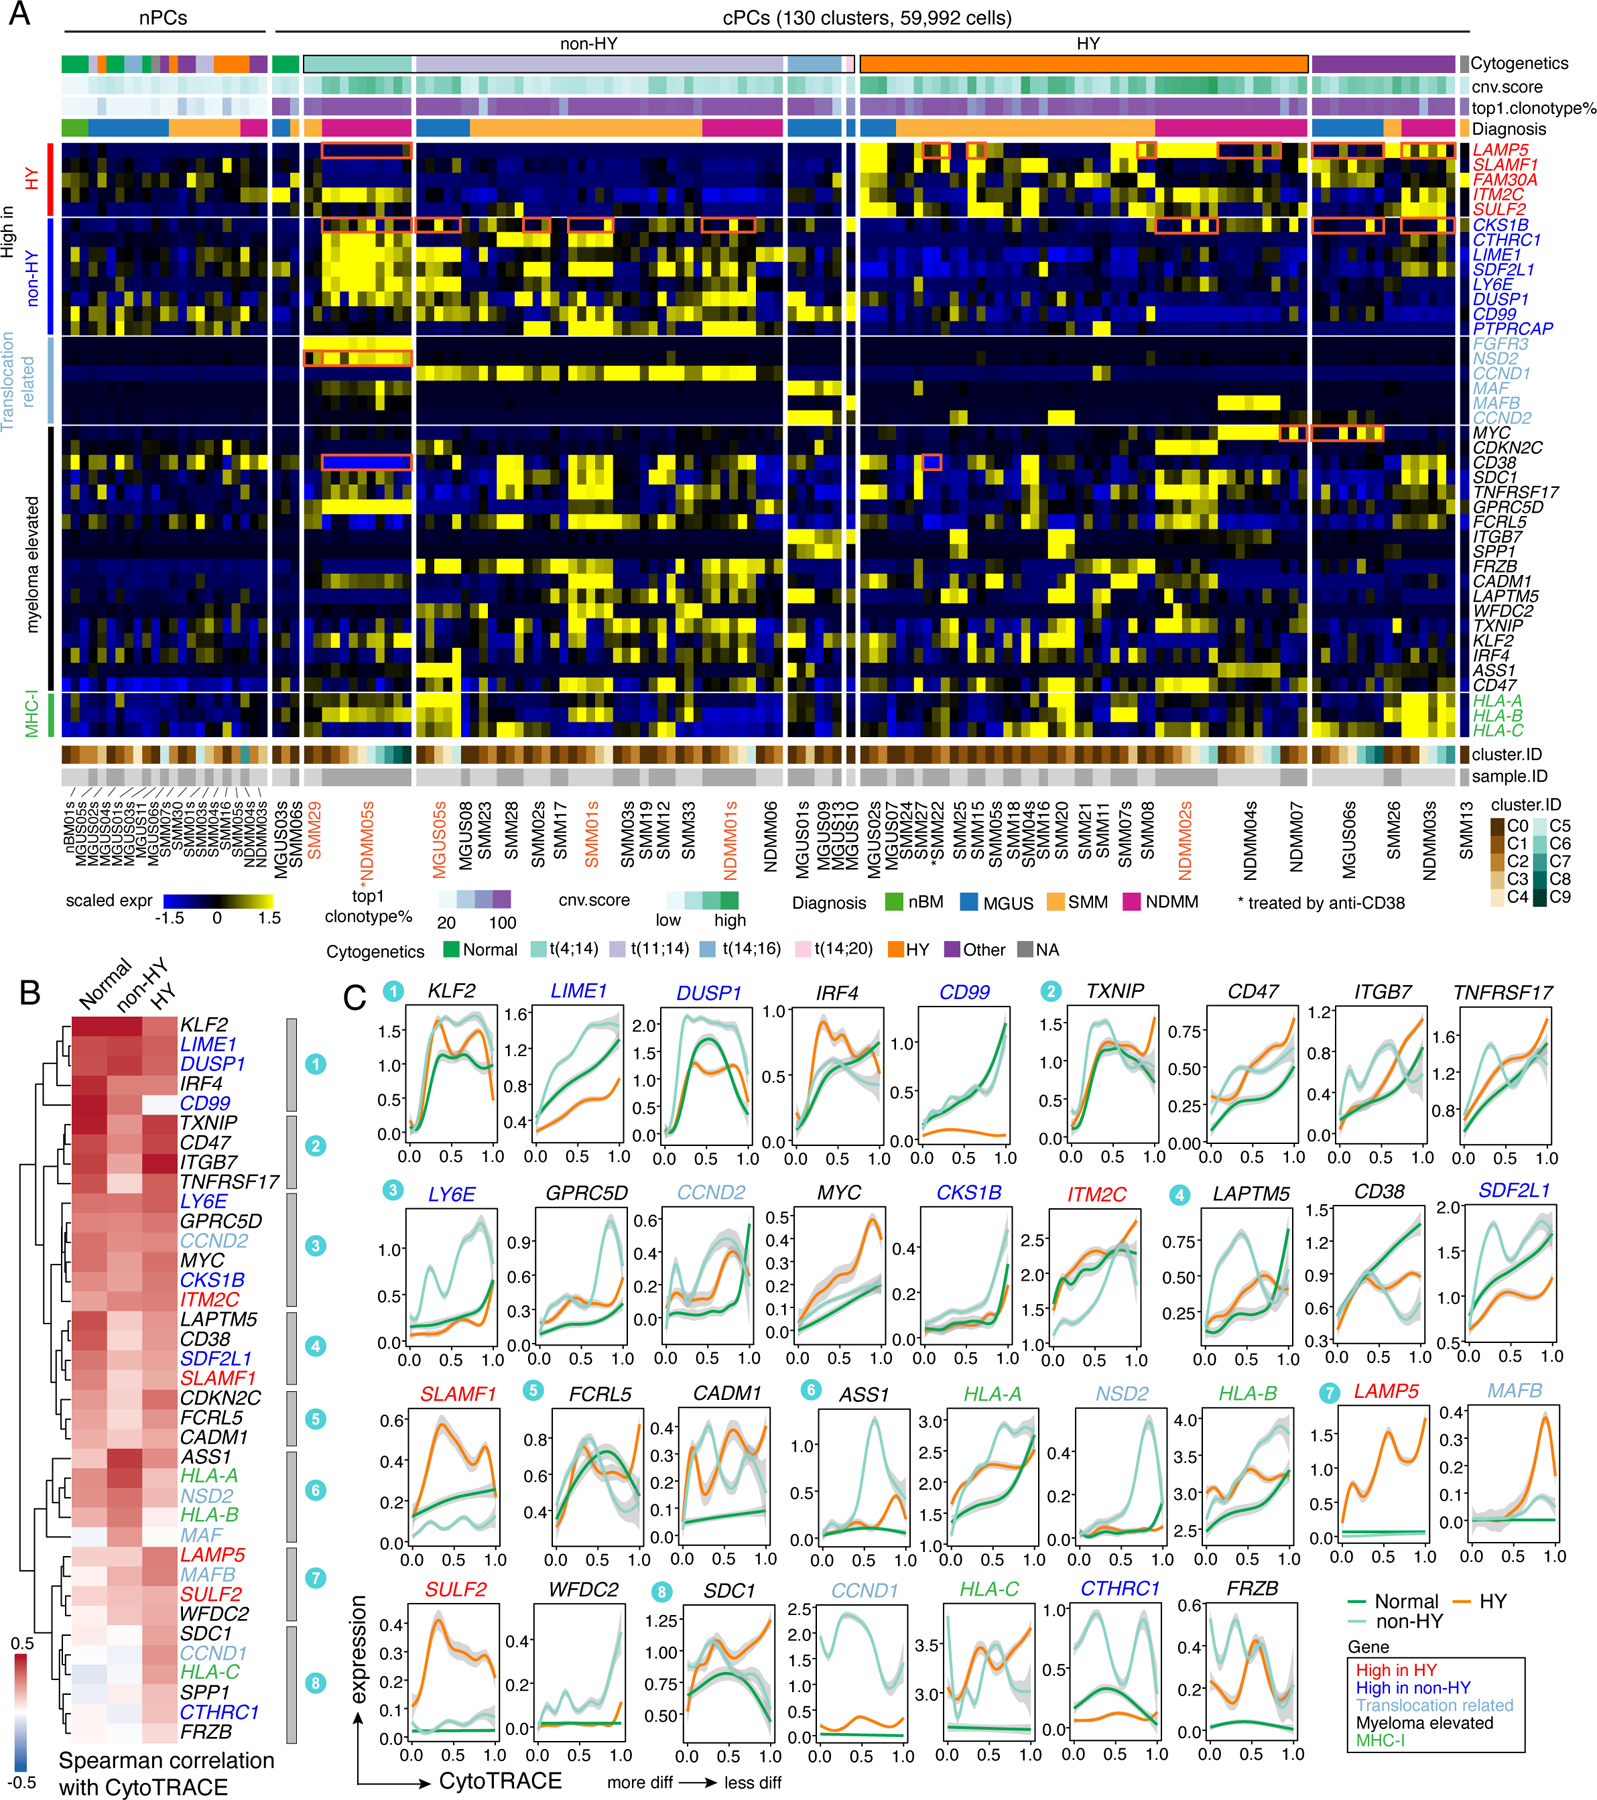
Figure 3. Intra-sample subcluster heterogeneity of myeloma related key genes is associated with genomic abnormalities and tumor evolution.

(A) Heatmap showing the scaled average expression of myeloma related key genes in PCs at intra-sample subcluster level. Clusters were firstly grouped by normal or clonal. Within the cPCs, clusters were ordered by cytogenetic abnormalities of corresponding patient origins. The top annotation tracks show (from top to bottom): the cytogenetic abnormalities of corresponding patient, the cluster averaged CNA score, proportion of cells harboring the most abundant clonotype in the cluster and diagnosis of corresponding patient. (B) Heatmap with hierarchical clustering by row showing spearman correlations of gene expression levels with CytoTRACE score separately in normal, non-HY and HY cells. Genes were color coded as shown in (A). (C) Two-dimensional plots showing the dynamic changes in expression levels of genes as shown in (A) along the CytoTRACE score. Genes were grouped by their cluster as shown in (B) and color coded as shown in (A). Shaded band, 95th confidence interval. See also Figure S4, Table S4.
