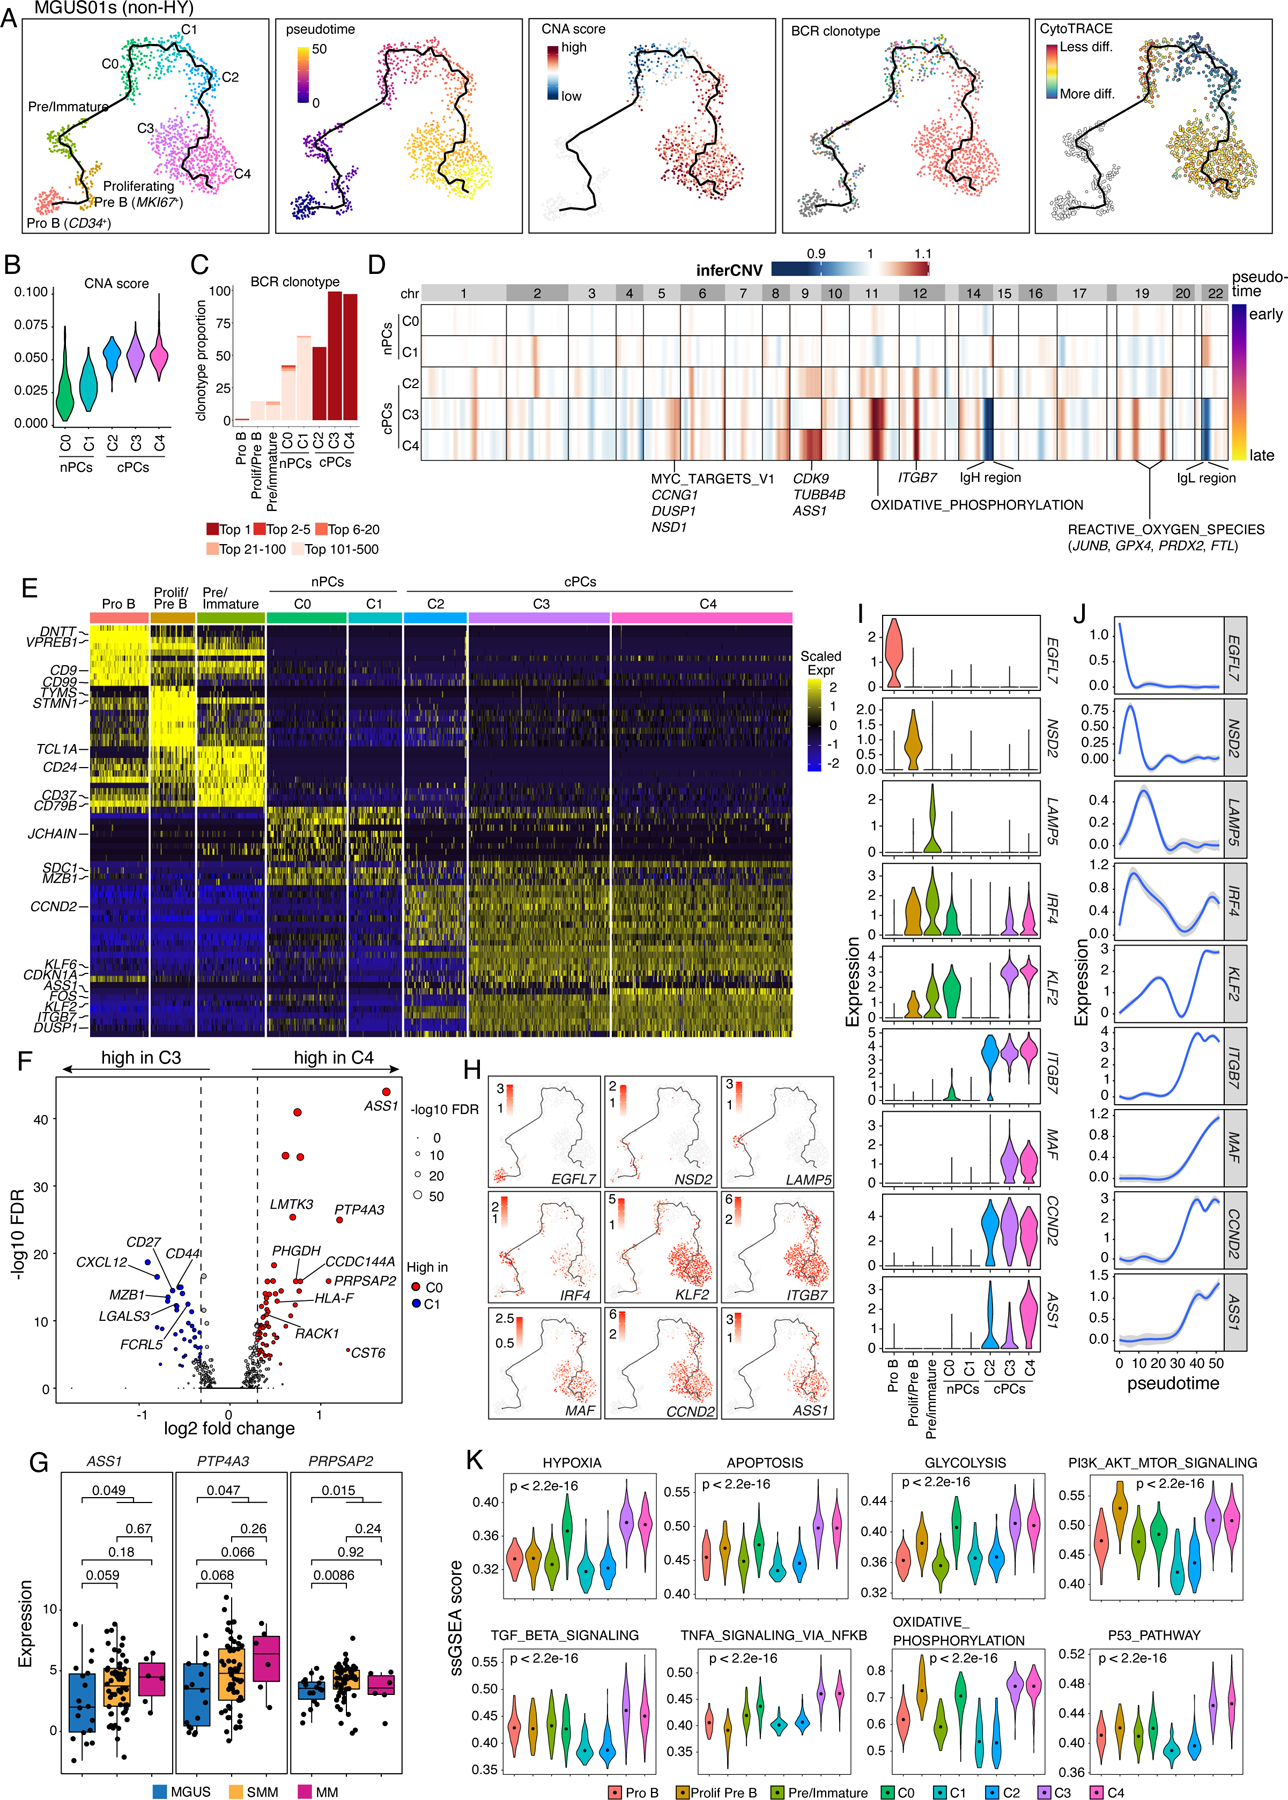
Figure 4. Intra-patient heterogeneity and evolution of B/plasma subpopulations for patient MGUS01s.

(A) Uniform manifold approximation and projection (UMAP) visualization of unsupervised clustering analysis of B cells and PCs from MGUS01s (n=1,210) with inferred trajectory and cluster label, pseudotime, CNA score, BCR clonotype and CytoTRACE score (from left to right) mapped on. Pro B cell cluster was selected as the root of trajectory. (B) Violin plots showing the differences of CNA scores in 5 PC subclusters. Clusters were ordered from early stage to late stage based on inferred pseudotime. (C) Stacked bar chart showing BCR clonotype distributions in each B and PC subclusters. Clonotypes were grouped and colored by clonotype frequency category. (D) Heatmap on the top showing genome wide inferred CNA profiles for 5 PC clusters of patient MGUS01s. Clusters were ordered by inferred pseudotime as shown on the right-hand side. Enriched hallmark pathways or important genes related to the most striking differences of CNAs between 5 clusters were labelled at the bottom. (E) Heatmap showing scaled expression of top 10 DEGs of B and PC clusters, with selected cluster specific DEGs labeled on the left. (F) Volcano plots of differentially expressed genes between PC cluster C3 and C4. FDR, two-sided Wilcoxon rank sum test with Bonferroni correction. Dashed line, log2FC > 0.3 or < −0.3. Labels, biologically important genes. (G) Boxplot showing the comparisons of expression levels of ASS1, PTP4A3 and PRPSAP2 between MGUS, SMM and MM in our validation cohort. (H) UMAP as in (A) showing the expression of representative genes. (I) The violin plots showing expression of representative genes across different B and PC clusters. Clusters were ordered from early stage to late stage based on inferred pseudotime. (J) Two-dimensional plots showing the dynamic changes in expression levels of representative genes as shown in (H&I) along the pseudotime. Shaded band, 95th confidence interval. (K) The violin plots showing gene set enrichment as measured by ssGSEA score of 10 representative hallmark pathways across different B and PC clusters. P values were calculated by one-way Kruskal-Wallis rank-sum test. See also Figure S5, Table S5.
