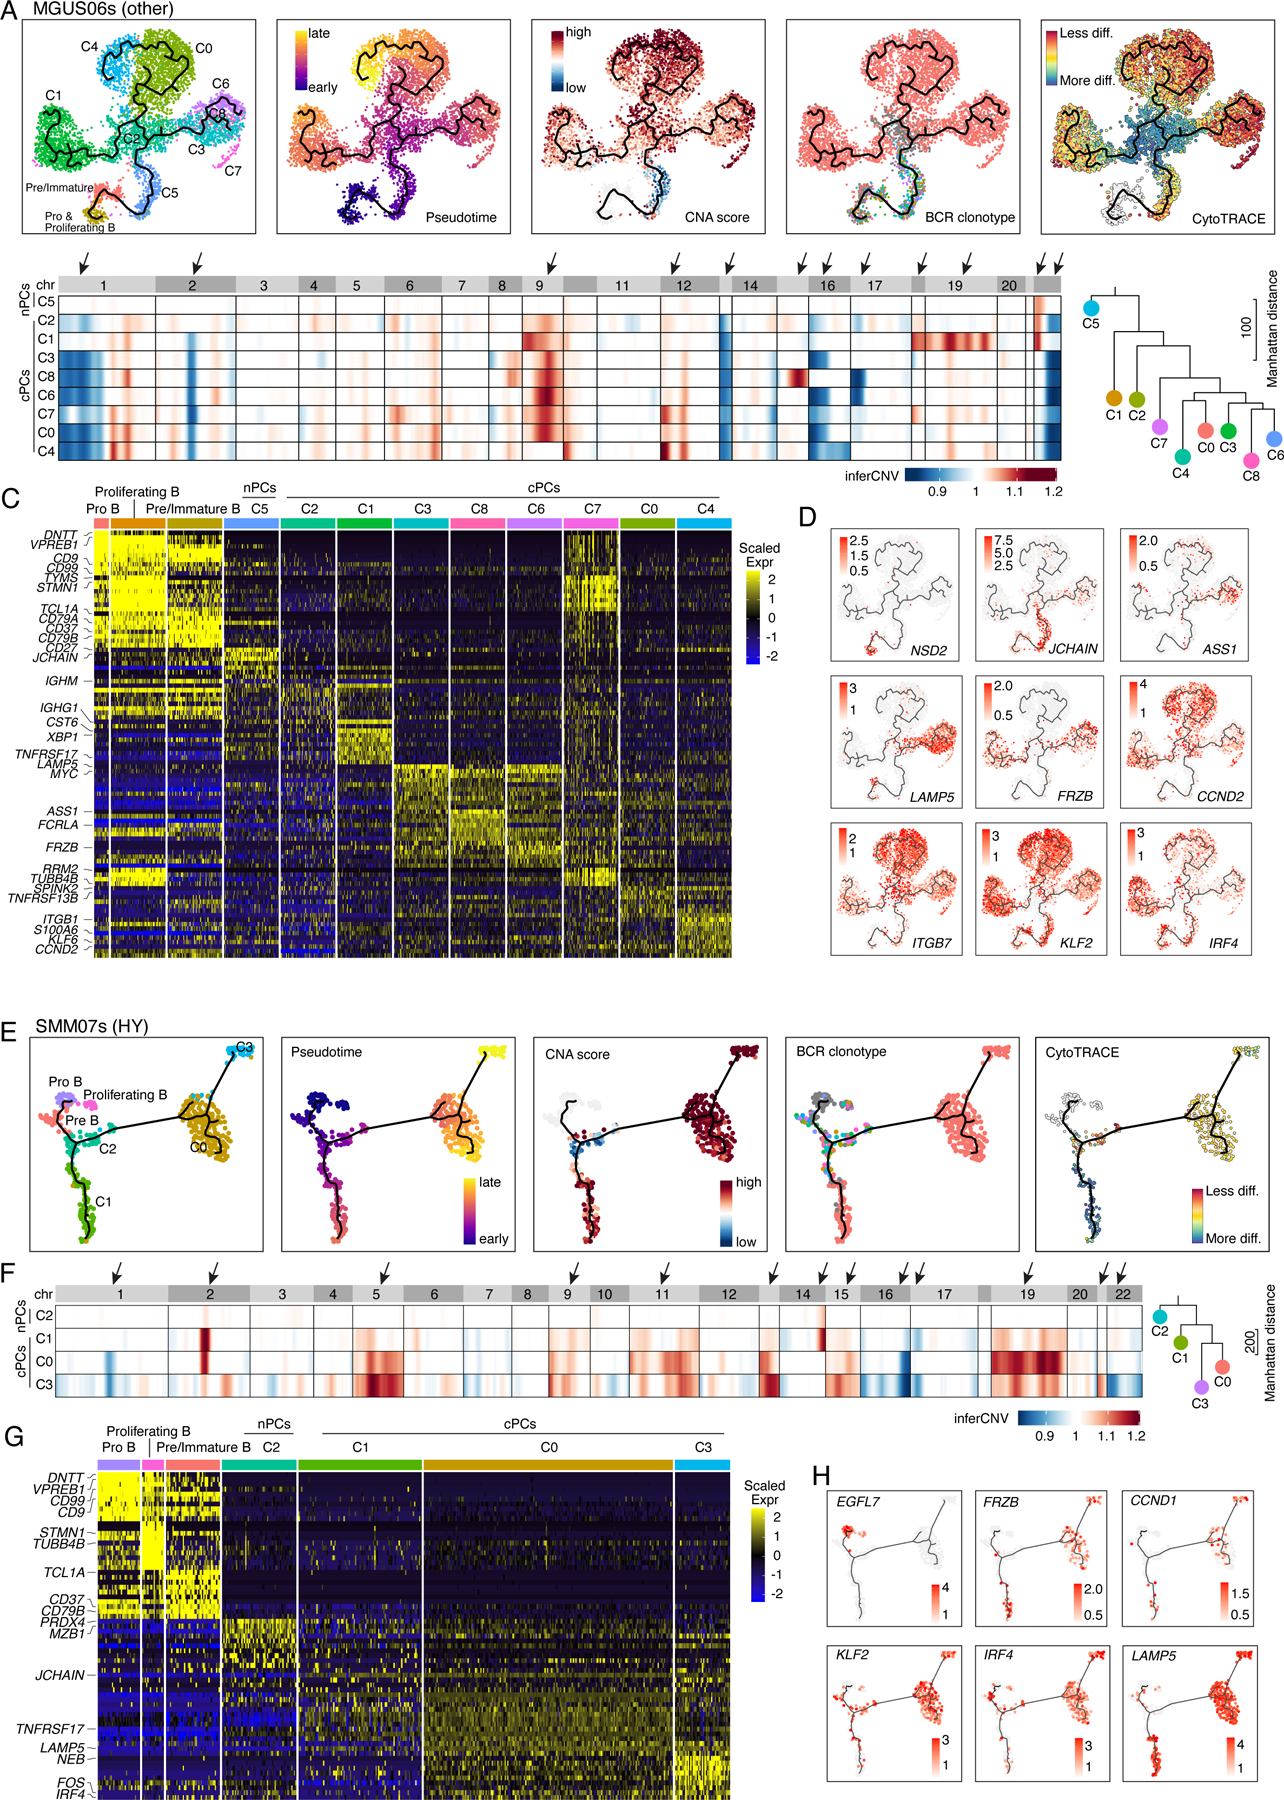
Figure 5. Intra-patient heterogeneity and evolution of B/plasma subpopulations for patient MGUS06s and SMM07s.

(A) Uniform manifold approximation and projection (UMAP) visualization of unsupervised clustering analysis of B cells and PCs from MGUS06s (n=5,660) with inferred trajectory and cluster label, pseudotime, CNA score, BCR clonotype and CytoTRACE score (from left to right) mapped on. Pro B cell cluster was selected as the root of trajectory. (B) Heatmap on the left showing genome wide inferred CNA profiles for 9 PC clusters of patient MGUS06s. Clusters were organized by inferred trajectories. Black arrows indicated the most striking differences of CNAs between 9 clusters. Phylogenetic tree on the right showing minimum evolution trees generated using cluster-averaged/consensus CNA profiles of subclusters for MGUS06s and rooted by a neutral node. (C) Heatmap showing scaled expression of top 10 DEGs of B and PC clusters, with selected cluster specific DEGs labeled on the left. (D) UMAP as in (A) showing the expression of representative genes. (E) UMAP visualization of unsupervised clustering analysis of B cells and PCs from SMM07s (n=483) with inferred trajectory and cluster label, pseudotime, CNA score, BCR clonotype and CytoTRACE score (from left to right) mapped on. Pro B cell cluster was selected as the root of trajectory. (F) Heatmap on the left showing genome wide inferred CNA profiles for 4 PC clusters of patient SMM07s. Clusters were organized by inferred trajectories. Black arrows indicated the most striking differences of CNAs between 4 clusters. Phylogenetic tree on the right showing minimum evolution trees generated using cluster-averaged/consensus CNA profiles of subclusters for SMM07s and rooted by a neutral node. (G) Heatmap showing scaled expression of top 10 DEGs of B cell and PC clusters, with selected cluster specific DEGs labeled on the left. (H) UMAP as in (A) showing the expression of representative genes. See also Figure S5, Table S5.
