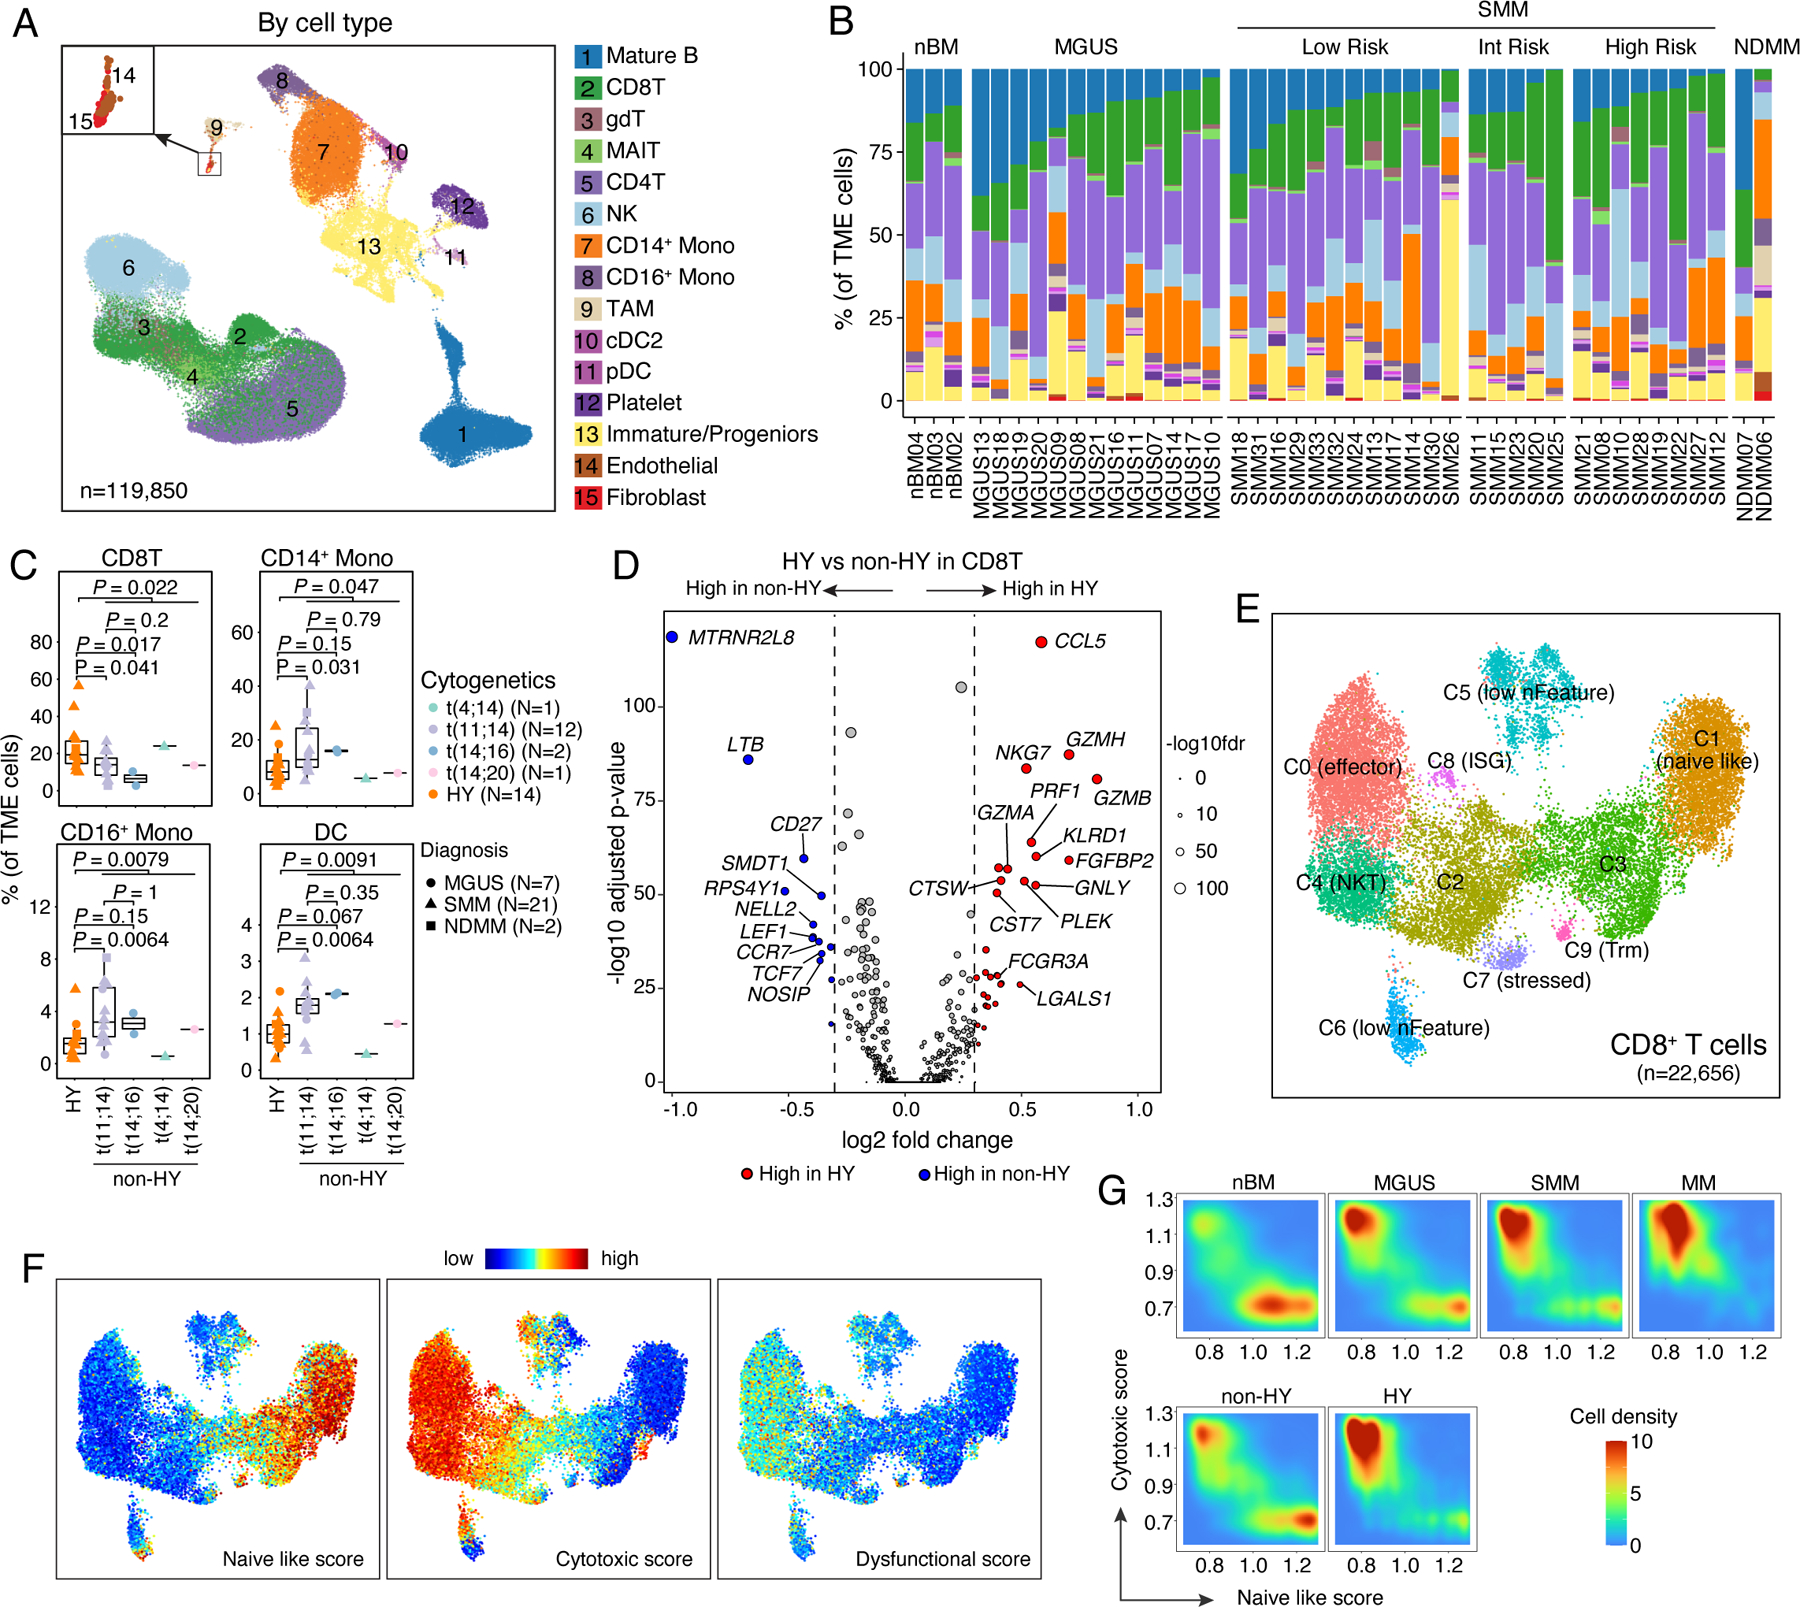
Figure 6. Landscape of tumor microenvironment.

(A) Uniform manifold approximation and projection (UMAP) visualization of unsupervised clustering analysis of all TME cells (n = 119,850). Cells were color coded for their identified cell types. (B) Stacked bar plots showing corresponding % cell type composition in each unsorted sample grouped by diagnosis. (C) Boxplots showing the comparisons of CD8 T cell, CD14+ monocyte, CD16+ monocyte and DC proportion in tumor microenvironment between samples in HY and different translocation subgroups. Dots are color-coded by cytogenetic abnormalities and shape-coded by disease stages. (D) Volcano plots of differentially expressed genes in CD8 T cells between non-HY and HY samples. FDR, two-sided Wilcoxon rank sum test with Bonferroni correction. Dashed line, log2FC > 0.3 or < −0.3. Labels, biologically important genes. (E) UMAP visualization of unsupervised sub-clustering analysis of CD8 T cells (n = 22,656). (F) UMAP as shown in (E) with cells colored by naïve-like score, cytotoxic score and dysfunctional score (from left to right) calculated using ssGSEA method. (G) Distribution of CD8 T cells based on their naïve like score and cytotoxic score in patient at different stages of disease (first row) or with different cytogenetic abnormalities (second row). See also Figure S6, Tables S3, S6.
