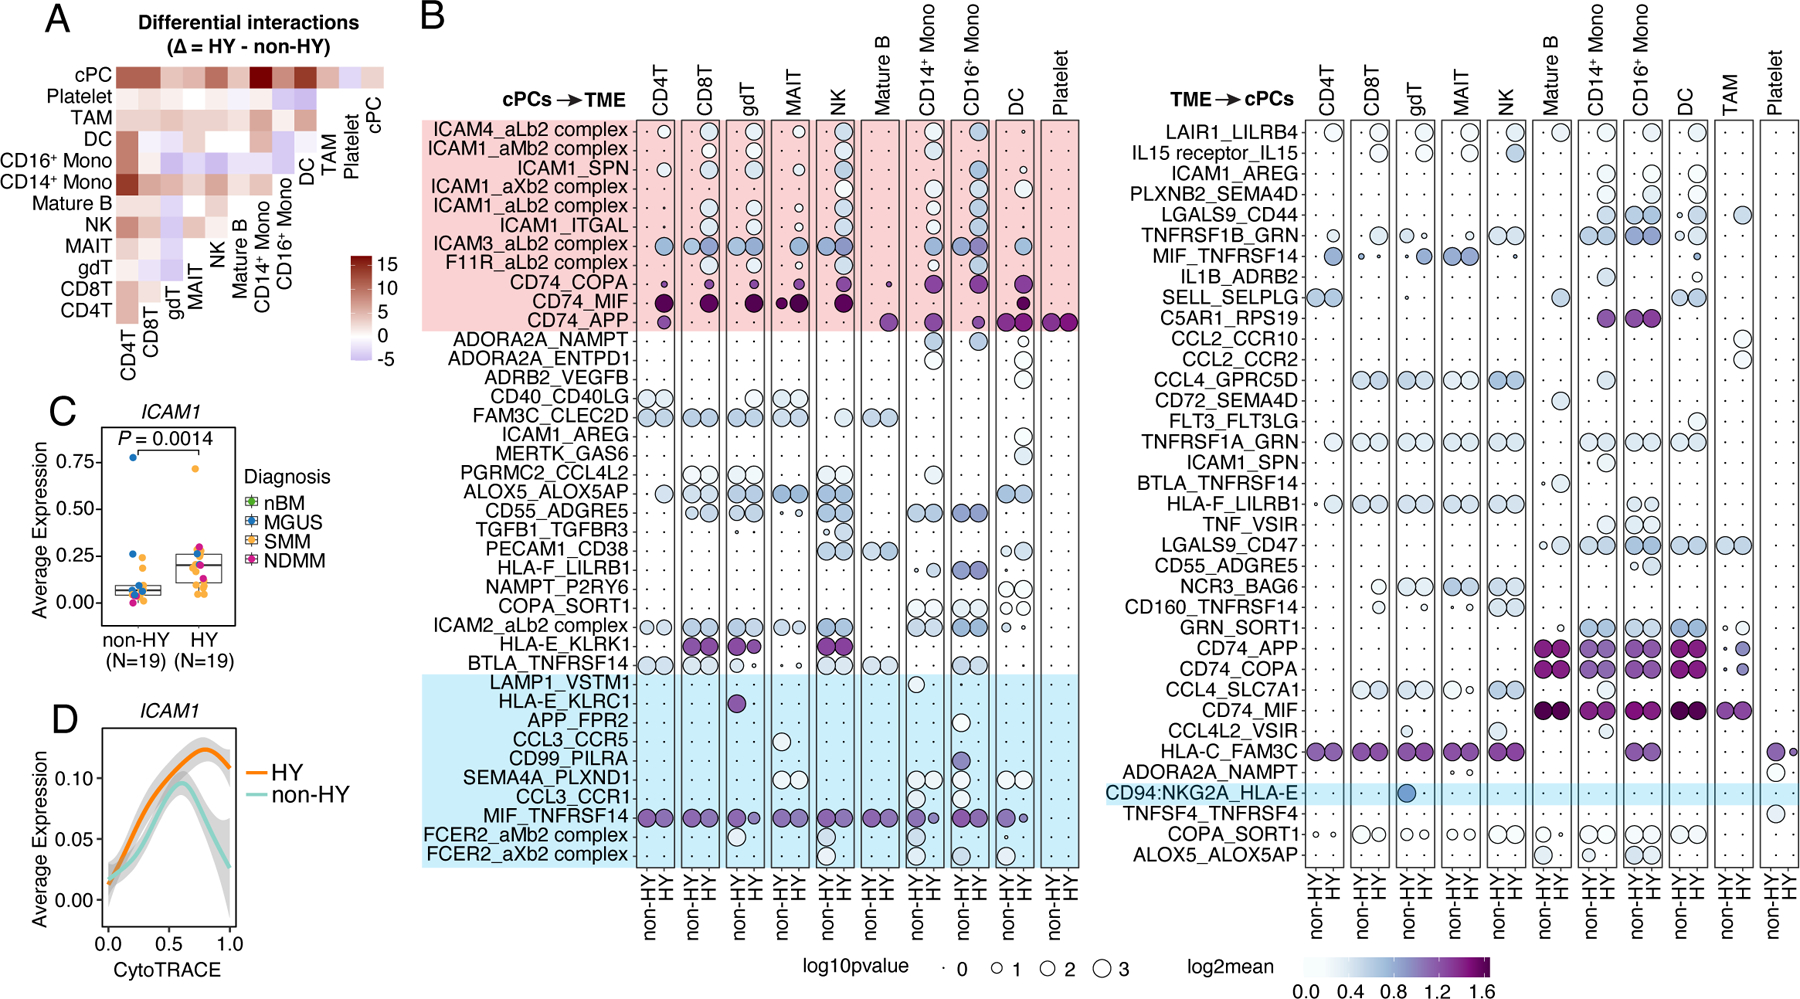
Figure 7. Cellular interactions between cPCs and TME cells.

(A) Heatmap showing the different number of interactions between each major cell types (#cells > 1000) inferred by CellphoneDB between non-HY and HY samples. Positive number means increasing in HY. (B) Bubble plot showing the mean expression (color key) and significance (size key) of ligand-receptor pairs between cPCs and TME cells. Only interactions that showed differences between non-HY and HY are shown. (C) Boxplots showing the comparisons of averaged expression of ICAM1 in cPCs between non-HY (N=19) and HY (N=19) at sample level. Dots were color coded by diagnosis. (D) Two-dimensional plots showing the dynamic changes in expression level of ICAM1 along the CytoTRACE score. Shaded band, 95th confidence interval. See also Figure S7.
