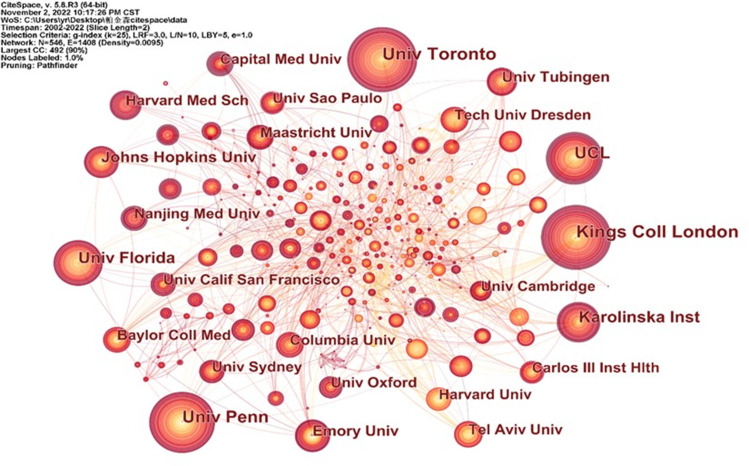
Figure 5.
The number of articles published by the organization. Upper left text, shows the relevant data, where “N” in “network” denotes the number of nodes, and the 546 nodes shown in the figure represent 546 research institutions and “E” denotes the number of connections between the 546 institutions shown in the diagram. The larger the number of nodes, the higher the output of the corresponding institution, and the more connected lines, the closer the relationship between the institutions.

