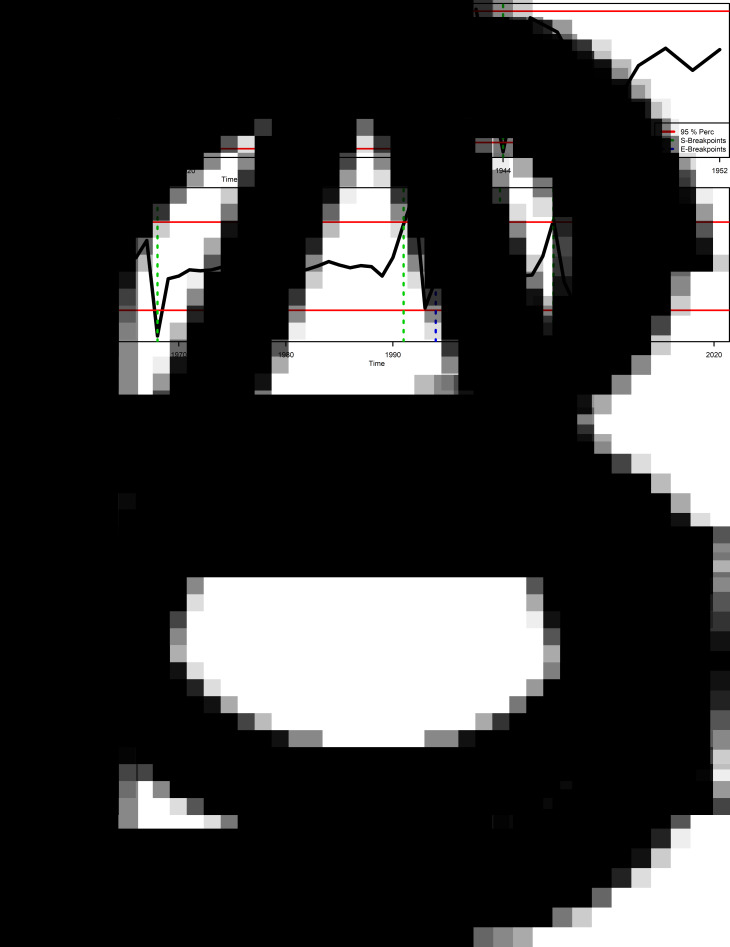
Fig. 2.
Malaria regime shift analysis (A) Annual difference in total cases (1913–1932) from the Costa Rica division of the United Fruit Company. (B) Annual difference in inpatient malaria cases (1942–1952) at the Hospital San Juan de Dios, San José, Costa Rica. (C) Annual difference in total malaria cases in Costa Rica (1957–2018) recorded by the Ministerio de Salud. In the panels dotted vertical lines indicate significant breakpoints potentially associated with regime shifts, indicating the start (S-breakpoints) and end of the breakpoints (E-breakpoints), while horizontal solid lines indicate the 95% percentiles of the data.

