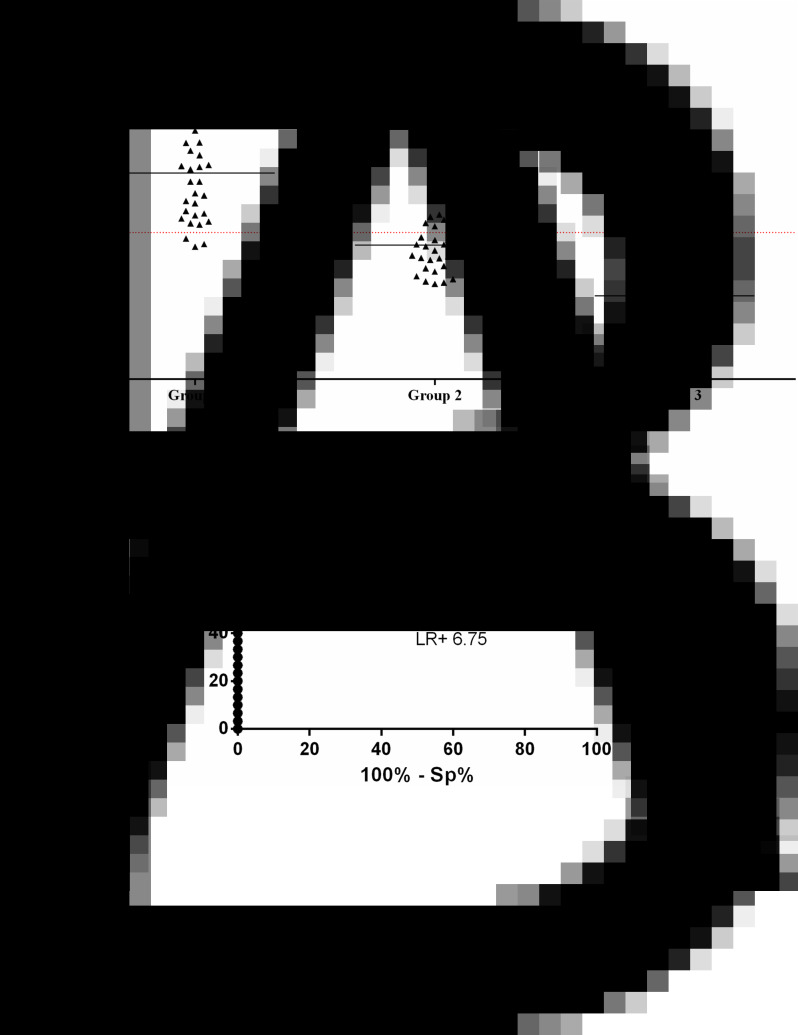
Fig. 3.
ELISA to detect ICs in serum samples from patients with hookworm active infection (group 1, n = 43), other parasitic infections (group 2, n = 30) and apparently healthy individuals (group 3, n = 30) using anti-hookworm IgY. A: scatter dot plots. Dotted line indicates cut off, samples were considered positive when OD >0.4, horizontal bars indicate median. B: ROC curve indicating AUC, sensitivity (Se), specificity (Sp) and positive LR (95% CI indicated).

