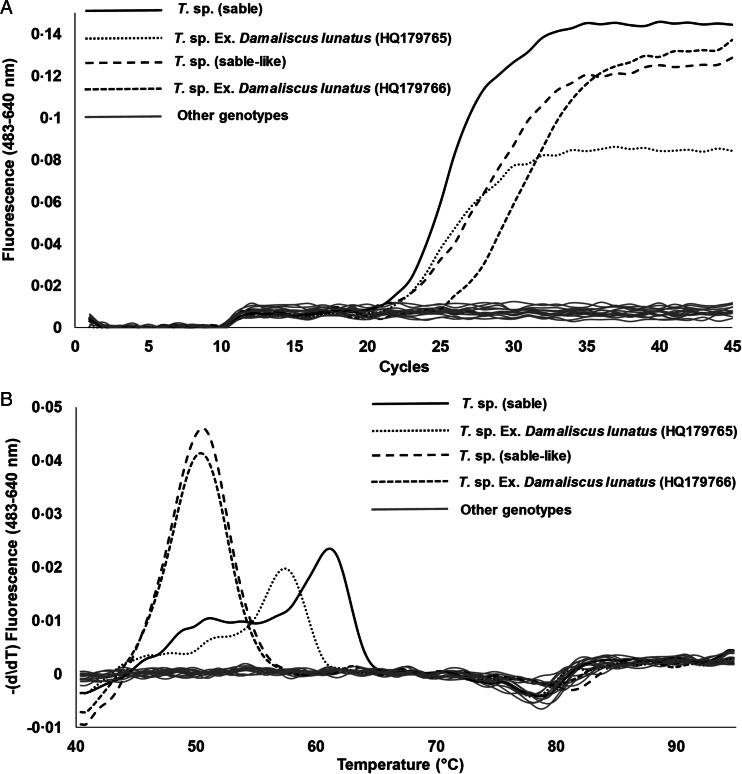
Fig. 2.
The hybridization assay for T. sp. (sable) and T. sp. (sable-like). (A) Amplification profiles for the positive controls and other genotypes tested in the study (section ‘Specificity of the assay’). (B) Melting curves for the positive controls and other genotypes tested in the study (section ‘Specificity of the assay’).

