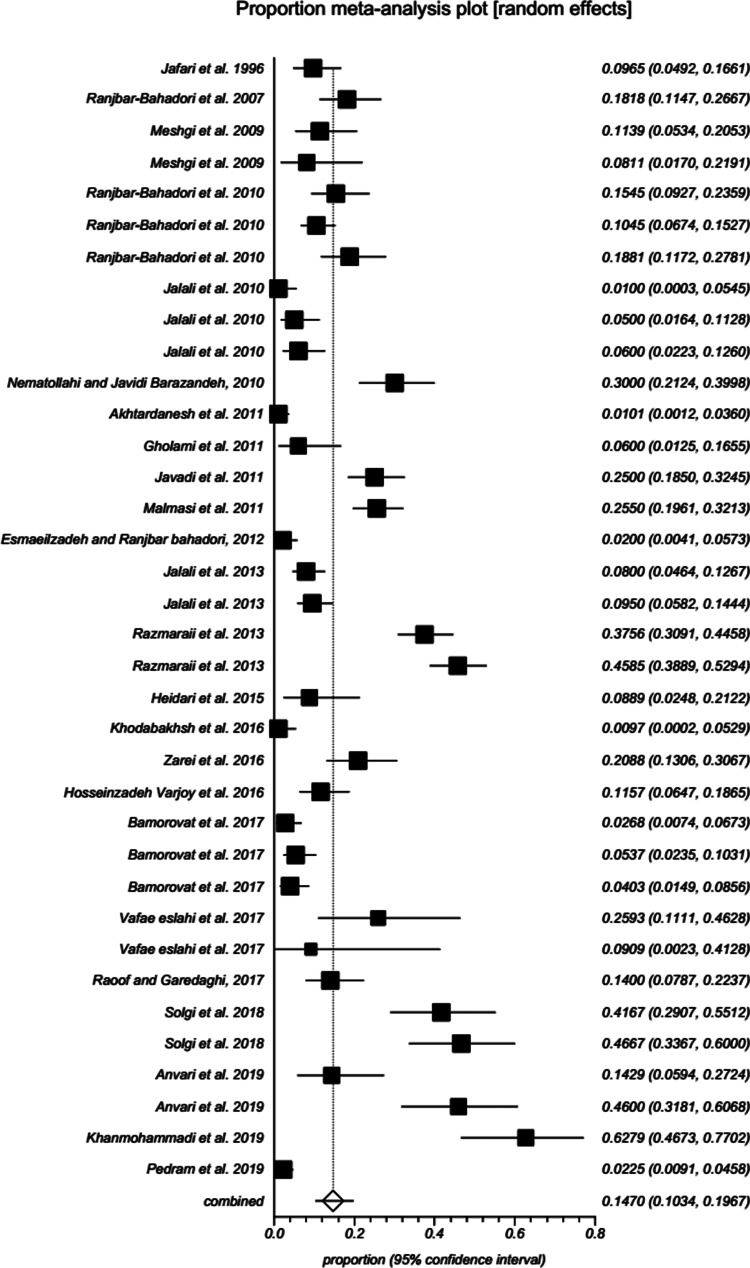
Fig. 2.
Forest plot of the prevalence of D. immitis in canids of Iran up to 1 December 2019. A square is appointed to each individual study with a horizontal line as confidence intervals and the area of each square is proportional to the study's weight in the meta-analysis. Also, a diamond is assigned to the meta-analysed measure of effect. A vertical line representing no effect is also plotted. If the confidence intervals for individual studies overlap with this line, it demonstrates that at the given level of confidence their effect sizes do not differ from no effect for the individual study.

