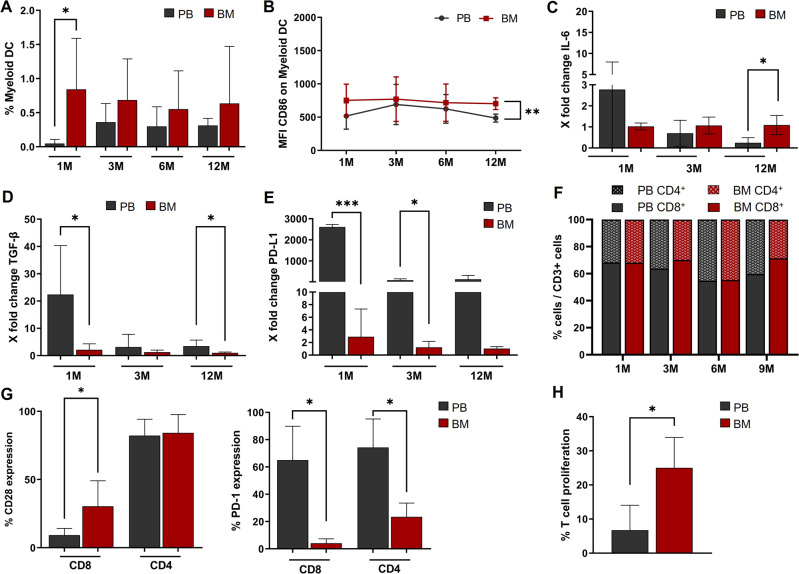
Fig. 1. Flow cytometry and real-time RT-PCR analysis of DCs, derived from BM or PB of transplanted patients. Flow cytometry analysis of CD4+ and CD8+ T cells and mixed culture of CD3+ T cells with BM- or PB-mDCs.
A The mDC percentage was higher in BM than in PB, in the first month after transplant (*Student’s t-test: p < 0.05). B BM-derived mDCs expressed higher levels of the co-stimulatory receptor CD86 (showed as MFI values), compared to PB-derived mDCs (**Student’s t-test: p < 0.01). C, D Real-time RT-PCR showed the gradual decrease of IL-6 and TGF-β expression, after transplantation, in PB-mDCs, while their levels in BM-mDCs remain stable. (*Student’s t-test: p < 0.05). E Real-time RT-PCR showed significantly higher PD-L1 levels in PB-mDCs compared to BM-mDCs (*Student’s t-test: p < 0.05; ***Student’s t-test: p < 0.001). All data (A–E) are represented as mean ± SD. F The percentages of CD3+, CD4+ and CD8+ T cells were comparable (Student’s t-test: p > 0.05) between BM and PB and among early and late follow-up phases (ANOVA: p > 0.05). Data are represented as mean. G Left Panel. BM-derived CD8+ T cells displayed a higher expression of the co-stimulatory receptor CD28 than PB-derived CD8+ T cells (30.3% ± 18.8 vs 9.2% ± 4.9; *Student’s t-test: p < 0.05). Data are represented as mean ± SD. Right Panel. The expression of the immune checkpoint inhibitor PD-1 was significantly higher in PB-derived CD4+ (69% ± 29 vs 24% ± 11; *Student’s t-test: p < 0.05) and CD8+ (65% ± 25 vs 4% ± 3; *Student’s t-test: p < 0.05) T cells than in BM-derived T lymphocytes. Data are represented as mean ± SD. H CD3+/CFSE+-mDCs co-cultures showed a T cell proliferation rate that was significantly higher when T cells were cultured in presence of BM-mDCs (25% ± 7.2 vs 6.7% ± 8.7; *Student’s t-test: p < 0.05). Data are represented as mean ± SD of 3 independent experiments.

