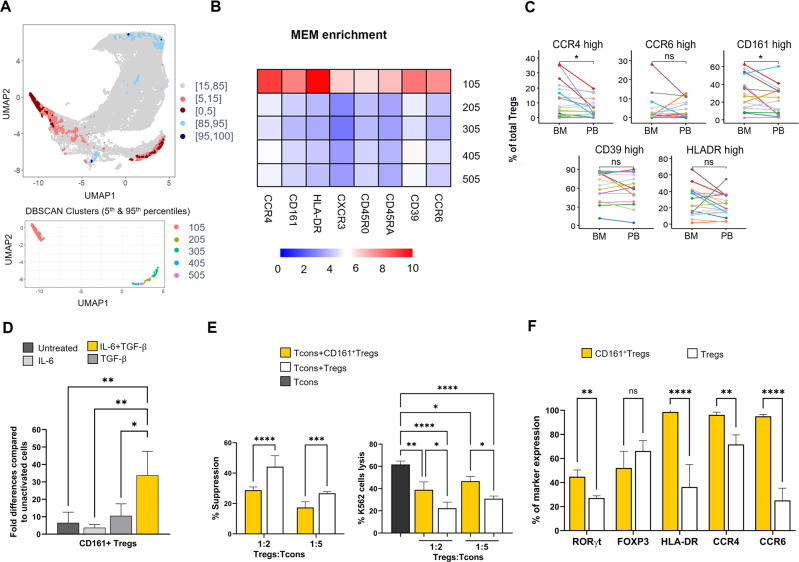
Fig. 2. Flow cytometric analysis of CD161+ Treg cells derived from BM or PB of transplanted patients, in vitro generation of CD161+ Treg cells with related functional experiments.
A Upper panel. UMAP plot with T-REX analysis of bone marrow and peripheral blood Tregs based on a statistical threshold of ≥ 95% change in cell phenotypes. Pink and red colour denote regions of phenotypic change identified by T-REX with a higher representation in bone marrow samples. Blue areas are enriched in peripheral blood. (Light colours: 85–95% change, dark colours: ≥95% change). Lower panel. DBSCAN clustering for the areas of ≥95% change. B Heatmap showing MEM enrichment of Treg markers in DBSCAN clusters. C Percentage of Tregs with high expression of CCR4, CCR6, CD161, CD39, HLA-DR in bone marrow and peripheral blood samples. Each patient is represented by a line. *p < 0.05 (two tailed paired Wilcoxon test). D PB-derived Tregs (CD4+CD25highCD127-/low), treated with both IL-6 and TGF-β, showed, after 10 days of culture, a significant higher expression of CD161 (One-way ANOVA, Tukey HSD test: *p < 0.05, **p < 0.01), if compared with cells untreated or treated with IL-6 or TGF-β alone. Untreated = cells only activated with T Cell TransAct™ and IL-2. Data are represented as mean ± SD of 3 independent experiments. E The graphs show the functional activity of CD161+ Tregs. Left panel. Suppression activity of CD161+ Tregs and expanded Tregs, referred as Tregs, on the proliferation of Trans Act stimulated-Tcons in a mixed lymphocyte reaction performed for 4 days. Data are presented as mean ± SD of 3 independent experiments (Two-way ANOVA, Sidak’s multiple comparison test; ****p < 0.0001; ***p = 0.0009). Right panel. Killing of the K562 cell line by Tcons, ratio Effector:Target 1:20. Where indicated, Tcons were co-coltured with CD161+ Tregs and Expanded Tregs, referred as Tregs, at different Tregs:Tcons ratio, 1:2 and 1:5 respectively (mean ± SD of 3 experiments; One-way ANOVA, Tukey’s multiple comparison test: Tcons alone vs + CD161+ Tregs ratio 1:2 **p = 0.001; vs + Tregs ratio 1:2 ****p < 0.0001; vs + CD161+ Tregs ratio 1:5 *p = 0.021; vs + Tregs ratio 1:5 ****p < 0.0001; + CD161+ vs Tregs ratio 1:2 *p = 0.011; + CD161+ vs Tregs ratio 1:5 *p = 0.015). F Flow cytometric analysis of the expression of RORγt, FOXP3, HLA-DR, CCR4, and CCR6 on CD161+ Tregs, defined as CD45+CD3+CD4+CD25highCD127-/lowCD161+ and Expanded Tregs, referred as Tregs and defined as CD45+CD3+CD4+CD25highCD127-/low (mean ± SD of 3 experiments; Two-way ANOVA, Sidak’s multiple comparison test, **p = 0.005; ****p < 0.0001).

