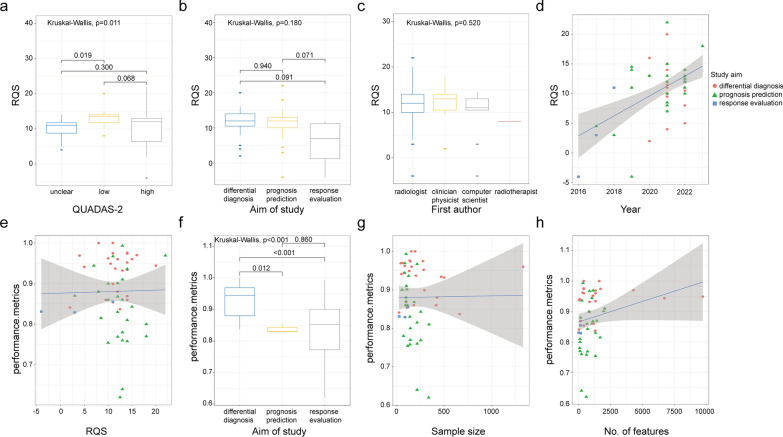
Fig. 3.
Correlations between radiomics quality score (RQS), performance metrics and baseline information. a–d Correlation between RQS and QUADAS-2, study aim, first author, and publication year. The vertical dashed line corresponds to the year of publication of the RQS. e–h Correlation between performance metrics and RQS, study aim, number of patients, and number of features. Each point corresponds to a study. The regression line and its 95% confidence interval are shown in gray with adjusted R2 and p-value

