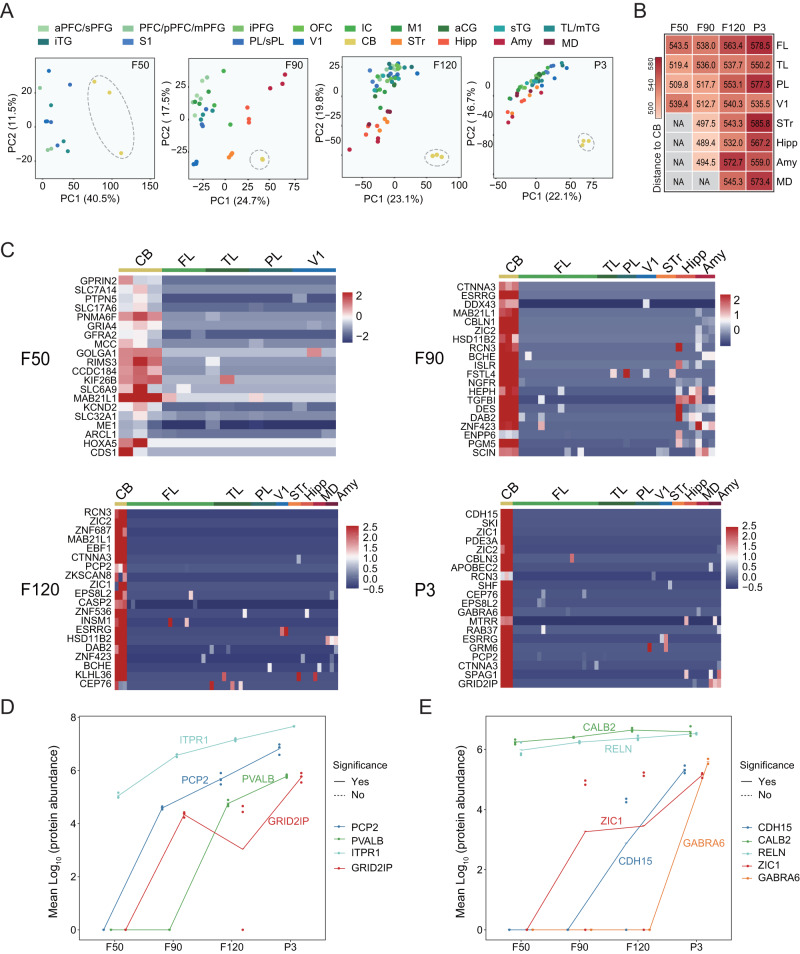
Fig. 3. Dynamic proteomic changes in cerebellum.
A Principal component analysis (PCA) showing the CB is distinct from other regions based on protein abundance across the four stages. Note: Three biological repeats were performed on all brain regions of the four stages except CB at the F90 stage. Instead, three technical replicates were performed from two CB samples at the F90 stage. B Heatmap showing the Euclidean Distance of CB to the other brain regions at the four stages. C Heatmap showing the abundance of the top 20 marker proteins in CB compared to the other brain regions at the four stages (F50, F90, F120, P3). D, E The line chart showing the abundance change of marker proteins for Purkinje cells (D) and granule cells (E) along with developmental stages in different brain regions. The dot and horizontal line indicate the sample value and mean value, respectively (n = 3). The solid line indicates that there is at least one significant difference between the two adjacent stages. The dashed line indicates no significant difference between any two adjacent stages. The p-values were calculated by two-sided Student’s t-test (D, E). Source data are provided as a Source Data file.

