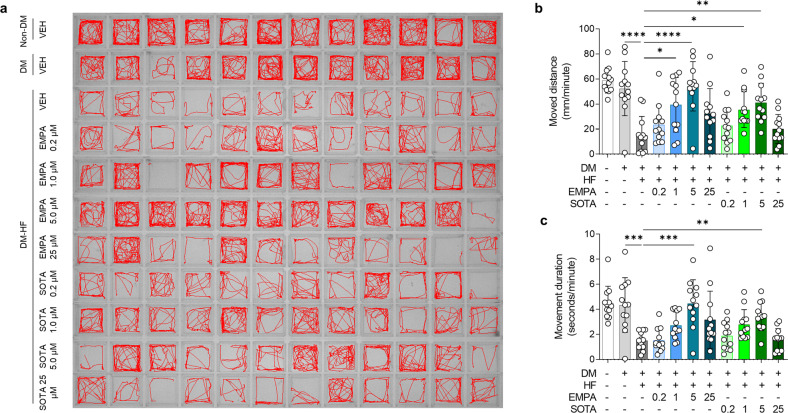
Fig. 2. Comparison of locomotion in DM-HFrEF zebrafish treated with empagliflozin or sotagliflozin.
a Representative locomotion tracking images of zebrafish larvae for a 5-minute period. b, c Average movement distance and movement duration per 1 min (n = 12 larvae per group). Data are presented as the mean ± standard deviation, and each dot represents the value for one zebrafish larva. *p < 0.05, **p < 0.01, ***p < 0.001, ****p < 0.0001 vs. the indicated group.

