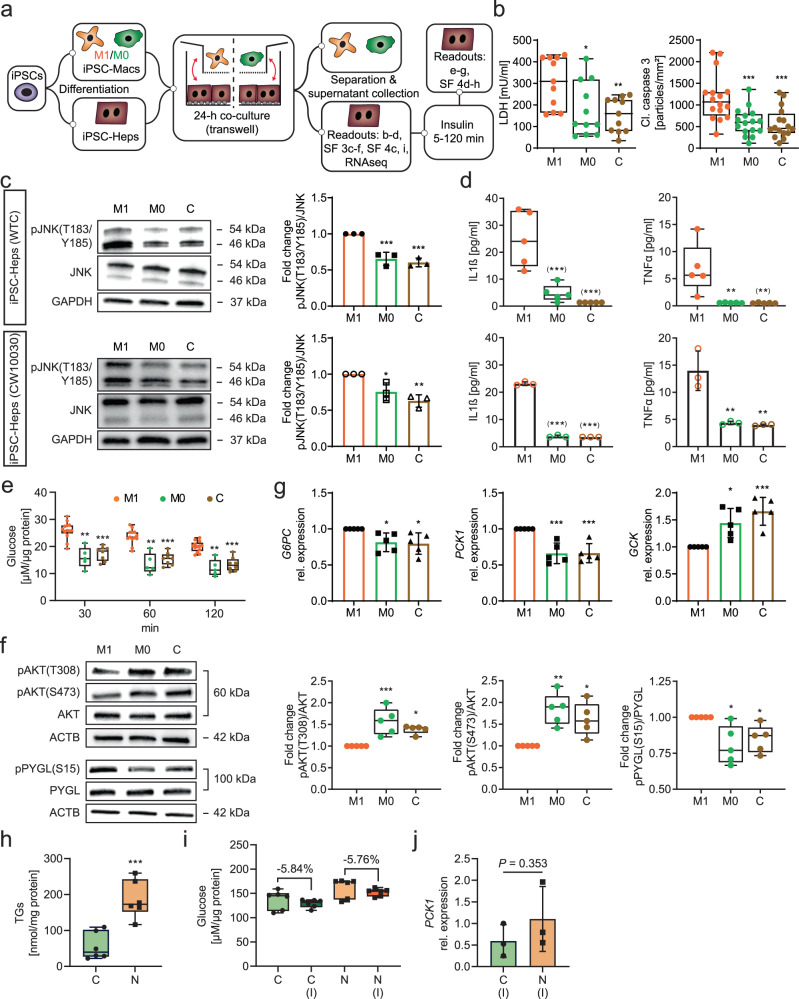
Fig. 2. Inflammation and glucose metabolism changes in iPSC-Heps co-cultured with M1 or M0 iPSC-Macs or accumulating lipid.
a Overview of experimental approach. SF, Supplementary Fig. b Quantification of LDH in media (n = 11) and of immunofluorescence of cleaved caspase 3 particles in iPSC-Heps (n = 4, 3 random regions/n). Data are mean ± SD; one-way ANOVA (Dunnett’s test), *P < 0.05, **P < 0.01 and ***P < 0.001 vs. M1. c, d Western blot analysis of JNK phosphorylation in iPSC-Heps (n = 3) (c) and pro-inflammatory cytokine release into media (WTC: n = 5, CW10030: n = 3) (d) after 24-h co-culture of iPSC-Heps with M1 or M0 iPSC-Macs or in iPSC-Hep mono-culture (C, control) comparing cells generated from the WTC and CW10030 iPSC lines. Data are mean ± SD; one-way ANOVA (Dunnett’s test), *P < 0.05, **P < 0.01 and ***P < 0.001 vs. M1. Asterisks in parentheses indicate values set to the detection limit of the assay. e–g Time course of analysis of glucose release into 1 mM glucose-containing media after insulin (M1: n = 13, M0: n = 5, C: n = 8) (e), western blot analysis of AKT and PYGL phosphorylation in iPSC-Heps 30 min after insulin (n = 5) (f) and gene expression analysis in iPSC-Heps 1 h after insulin (n = 5) (g) after 24-h co-culture of iPSC-Heps with M1 or M0 iPSC-Macs or in iPSC-Hep mono-culture (C, control). Data are mean ± SD; two-way (e) or one-way (f, g) ANOVA (Dunnett’s test), *P < 0.05, **P < 0.01 and ***P < 0.001 vs. M1. h–j Quantification of triglycerides (TGs) in iPSC-Heps (n = 6) (h), quantification of glucose release into 1 mM glucose-containing media after 2 h without or with insulin (I) (n = 6) (i) and gene expression analysis in iPSC-Heps 1 h after insulin (n = 3) (j) comparing iPSC-Heps from 3 healthy (C, control) and 3 NASH (N) patients. Data are mean ± SD; unpaired two-tailed Student’s t test, ***P < 0.001. Source data are provided as a Source Data file.

