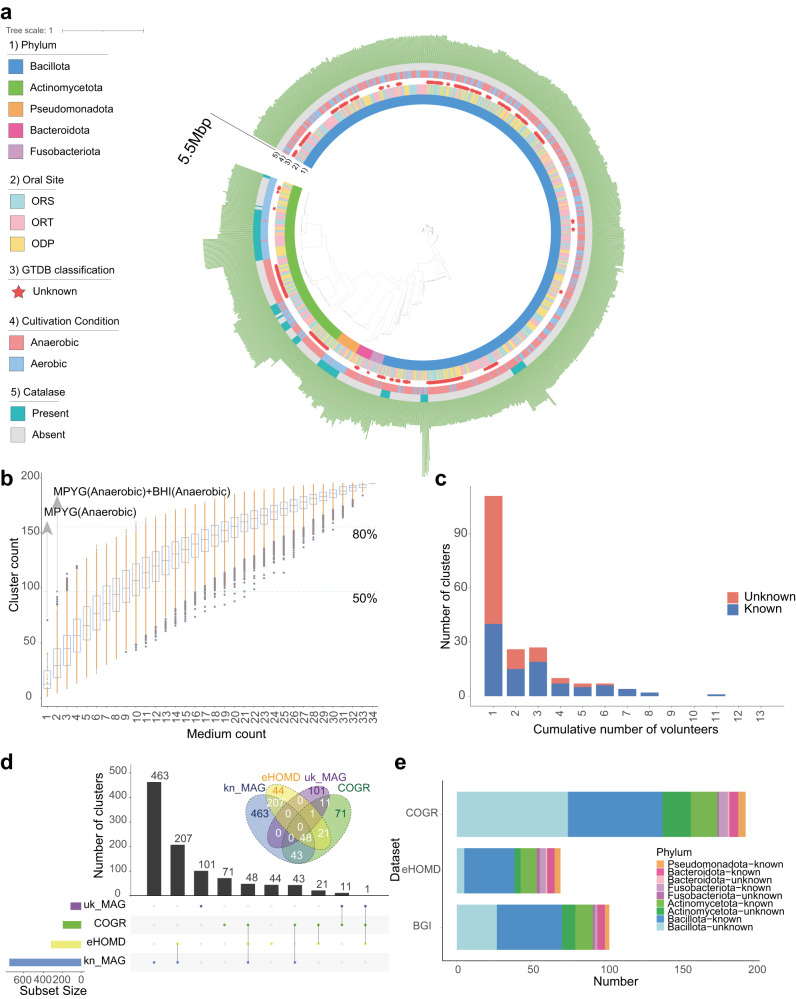
Fig. 1. The genome profile of COGR.
a Phylogenetic tree of 1089 COGR genomes based on GTDB annotation. The first circle is colored according to phyla, the second circle is colored according to the origin of the sample, the third circle highlights unknown genomes, the fourth circle is colored according to culture condition, the fifth circle is colored according to presence/absence of catalase, and the outermost circle represents genome length. b Rarefaction curve for the number of clusters obtained from different culture conditions. The MPYG (anaerobic) resulted in the highest count of clusters using one medium, the combination of MPYG (anaerobic) and BHI (anaerobic) resulted in the highest count of clusters using two media. The blue dash line marks the condition that provided 50% and 80% of the clusters of COGR. c The number of clusters shared by different numbers of volunteers. For example, when the cumulative number is 2, the ordinate indicates the number of clusters shared by two volunteers. d The upset plot and the Venn diagram of the comparison of different oral genome datasets. e Number of genomes of COGR mapped to the other two datasets.

