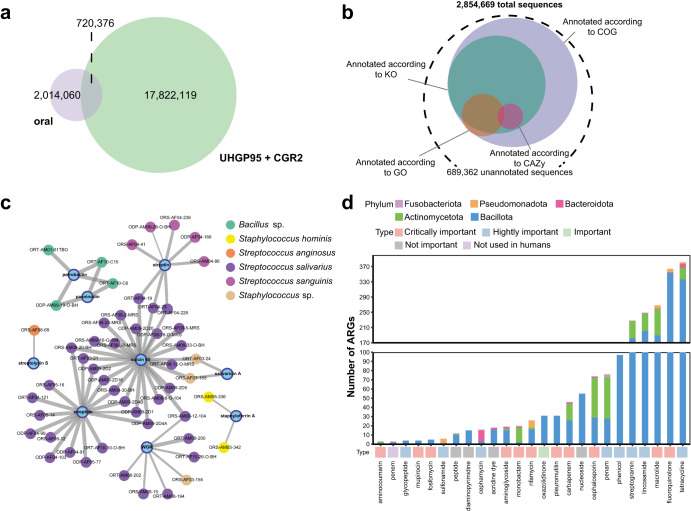
Fig. 2. Functional profile of COGR.
a Venn diagram of unique and shared protein sequences between oral and gut catalogs. b Annotation of 2,854,669 protein sequences according to COG, KO, GO and CAZy databases. c Sequence similarity network of our identified BGCs with known BGCs (similarity >70%,). The nodes in blue represent the known BGCs in the MiBIG database, and the remaining nodes represent identified BGCs in COGR, annotated with the genome name and colored by their species. The width of edges reflects degree of similarity. d Number of annotated ARGs and their distribution. The bottom square is colored according to the importance of drug usage.

