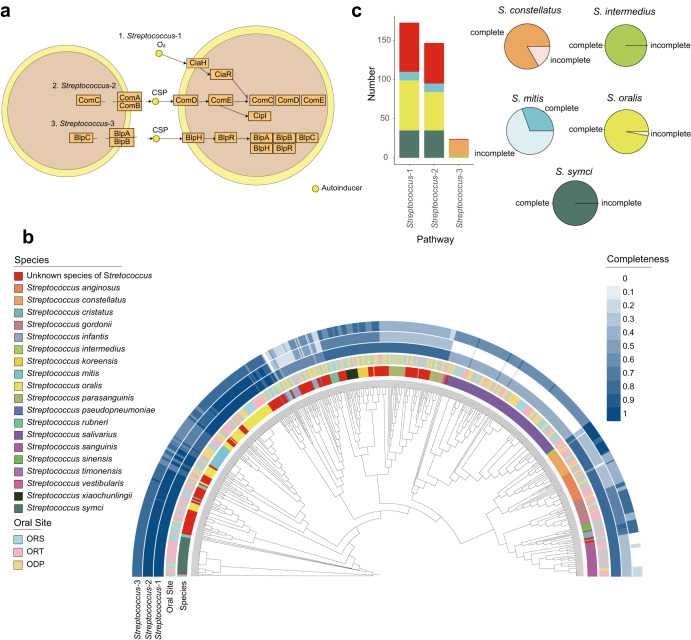
Fig. 3. Quorum sensing in Streptococcus.
a Schematic overview of quorum sensing pathways in Streptococcus (KEGG map02024 (https://www.genome.jp/pathway/map02024)). Genes are represented as orange boxes and the small yellow circles represent autoinducers. Two cells are depicted. b Phylogenetic tree of Streptococcus strains in COGR. The innermost circle is colored according to species and the second circle is colored by according to the oral sampling site. The outer three circles are colored according to the completeness of three quorum sensing pathways in Streptococcus. c The bar plot on the left shows the number of species harboring the complete quorum sensing pathway. The pie chart on the right shows the proportion of complete and incomplete coverage of the quorum sensing pathway in the indicated species of COGR. The color code in (c) is the same as that used in (b).

