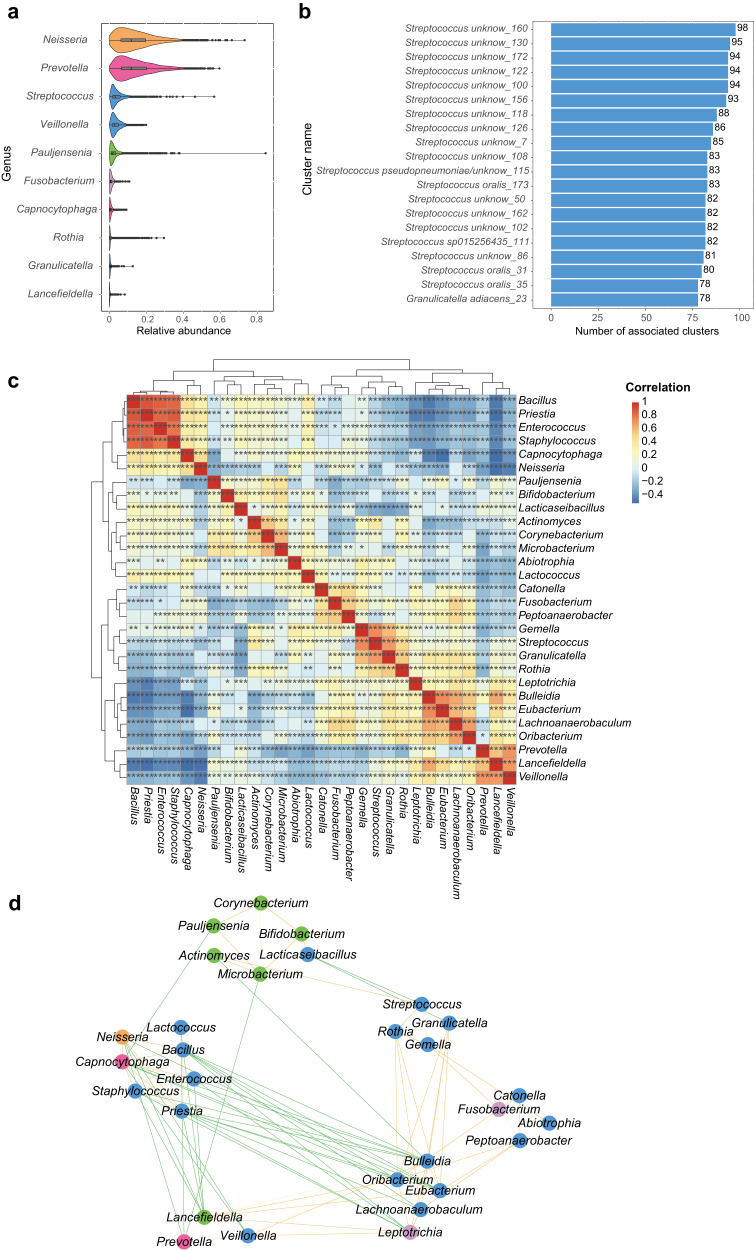
Fig. 4. Mapping of 195 representative strain genomes of each cluster from COGR to 4362 oral metagenomes.
a Genera with relative abundance ranking in top 10 in 4362 metagenomes, colored by phylum. b The top 20 clusters with the highest number of associations to other clusters in COGR in a co-occurrence analysis between the 195 clusters. The clusters are named as “GTDB species_cluster number.” c Co-occurrence heatmap of 29 genera based on the relative abundances in the metagenomes. Red color represents positive relationships while blue represents negative relationships. The stars marked in the boxes represent significance. d Network of 29 genera based on the correlation analysis (r > 0.3). The nodes are colored by phylum. Positive correlations are shown by orange lines and negative correlations by green lines. The width of the lines reflects the strength of the correlation. The phyla color codes are as in Fig. 1.

