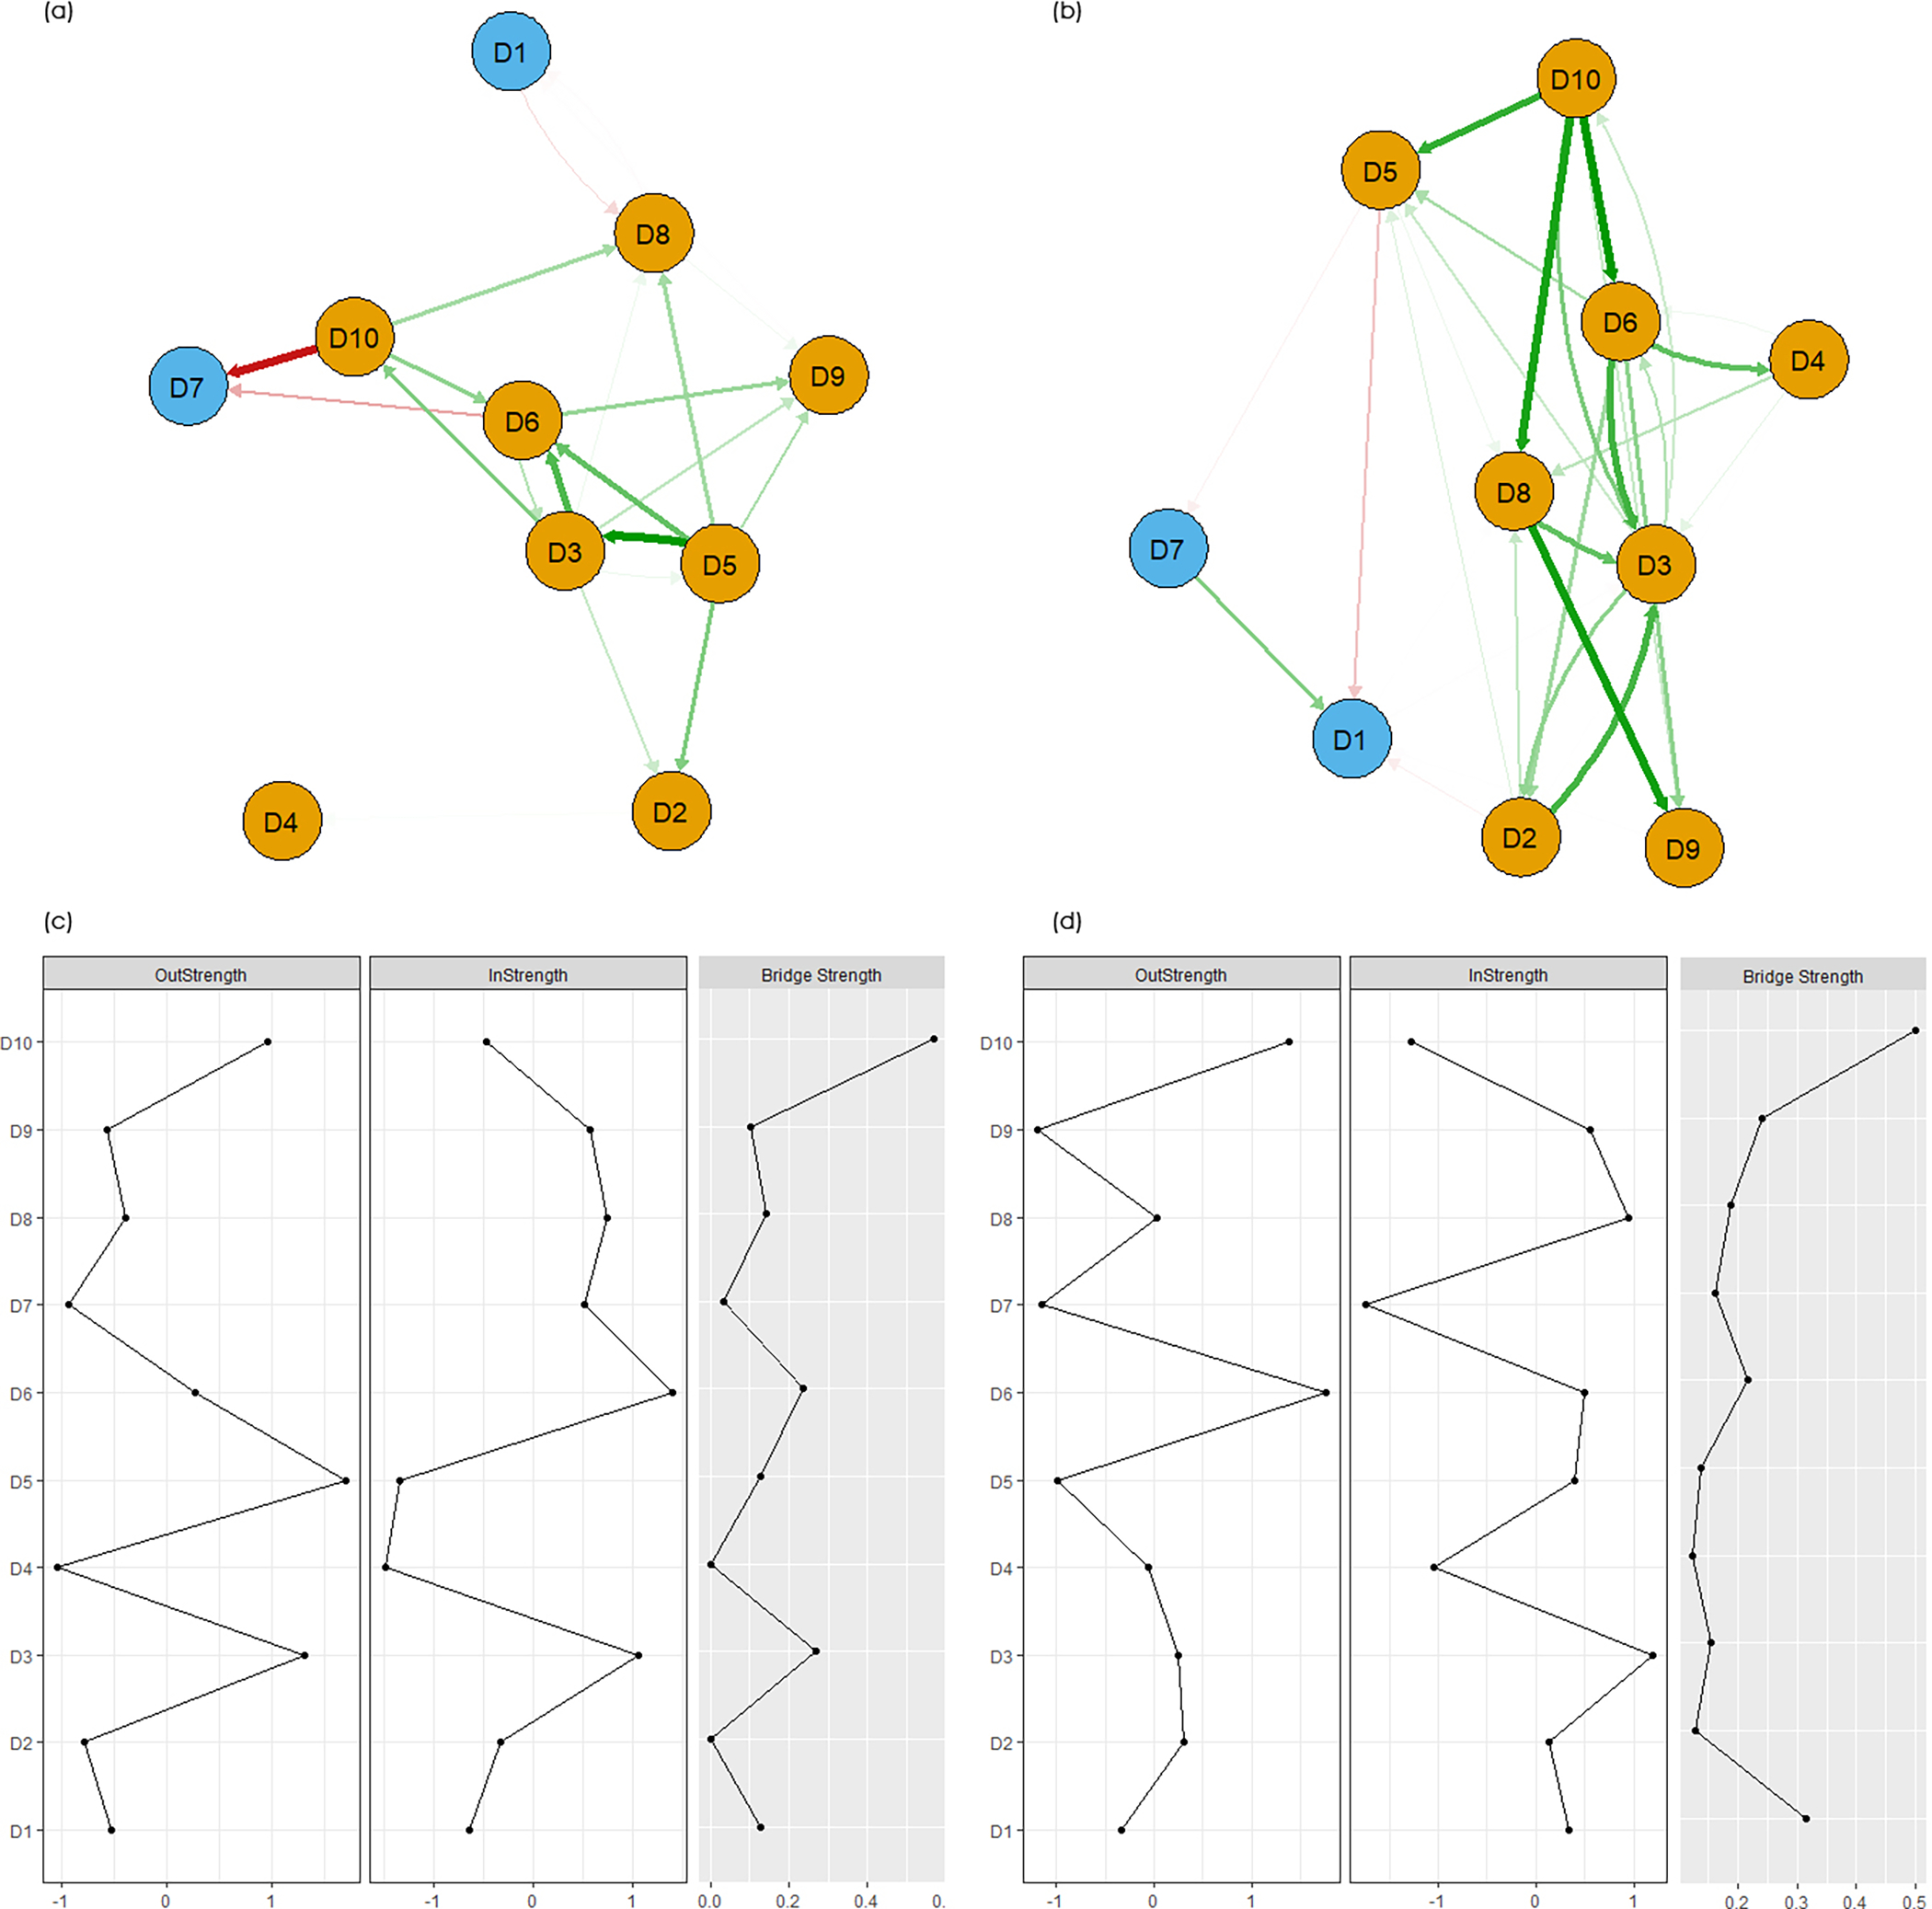
Figure 3.

Dynamic networks in urban and rural populations. (a) Dynamic networks in urban populations; (b) Dynamic networks in rural populations; (c) Centrality and bridge centrality of 10 nodes in network in urban populations; (d) Centrality and bridge centrality of 10 nodes in network in rural populations. D1=happy, D2=felt lonely, D3=felt depressed, D4=sleep was restless, D5=could not get going, D6=felt everything I did was an effort, D7=felt hopeful about the future, D8=bothered by things, D9=had trouble keeping my mind, and D10=felt fearful. Blue nodes and bars represent positive affects. Yellow nodes and bars represent negative symptoms.
