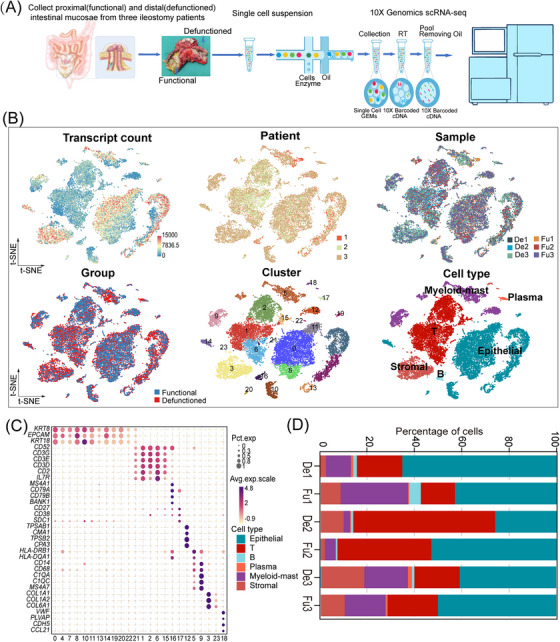
FIGURE 1.

A single‐cell atlas of functional (Fu) and defunctioned (De) intestinal mucosae. (A) Workflow depicting the collection and processing of specimens of Fu and De intestinal mucosae for single‐cell RNA sequencing analysis. (B) t‐Stochastic neighbor embedding (tSNE) plots for the 21 245 high‐quality cells showing distributions of transcript counts, patients, samples, groups, cell clusters and cell types. (C) Dot plot showing the smoothed expression distribution of marker genes in six cell types. (D) Proportion of each cell type in six samples.
