FIGURE 2.

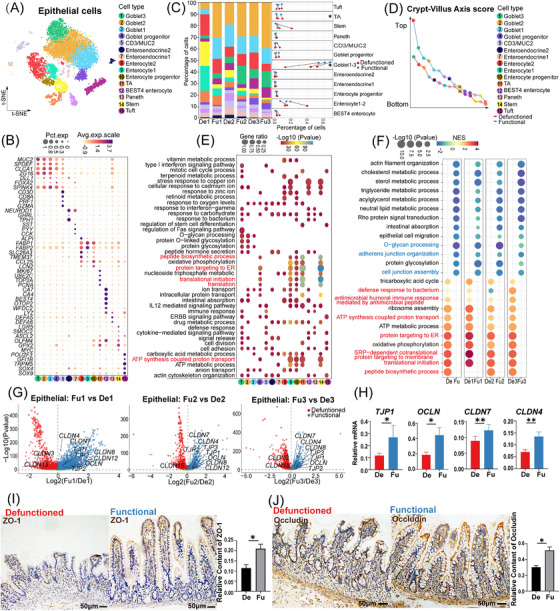
Classification and functional (Fu) annotation of epithelial cells, differences in epithelial cells between the Fu and defunctioned (De) intestines. (A) t‐Stochastic neighbor embedding (tSNE) plot showing 15 subsets of epithelial cells. (B) Dot plot showing the expression of significant marker genes in 15 cell types. (C) Proportion of each epithelial cell subset in the Fu and De intestines (*p < .05, paired t‐test). (D) Crypt–villus axis curve of the Fu and De intestines. Crypt–villus axis scores indicate the distance from the bottom of the crypt. (E) Gene ontology enrichment of marker genes (log2FC > 1, p < .05, Wilcoxon rank‐sum test) in each cell type. (F) Gene set enrichment analysis showing enriched biological pathways in epithelial cells of the Fu and De intestines (p < .05). (G) Volcano plots showing significant differential expression of genes related to tight junction between epithelial cells of the Fu and De intestines (p < .05, Wilcoxon rank‐sum test). (H) Relative mRNA expression of TJP1, OCLN, CLDN4 and CLDN7 in epithelial cells of the Fu and De intestines was confirmed using quantitative PCR (*p < .05, **p < .01, n = 7). (I and J) Immunohistochemistry staining of ZO‐1 and occludin in the De and Fu intestines (*p < .05, n = 5, scale bars = 50 μm). (H–J) Paired Wilcoxon rank‐sum test. All values are presented as mean ± SEM of each group. NES, normalized enrichment score.
