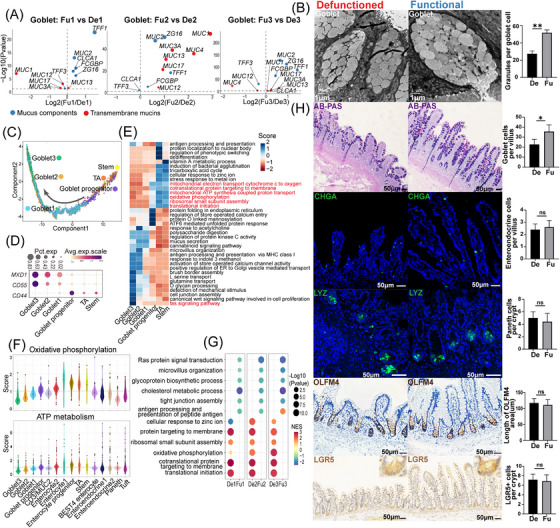
FIGURE 4.

Changes in goblet cells of the defunctioned (De) intestine mediated by ileal faecal diversion. (A) Volcano plots showing significant differential expression of genes related to mucus components and transmembrane mucins in goblet cells between the functional (Fu) and De intestines (p < .05, Wilcoxon rank‐sum test). (B) Transmission electron microscope images showing mucin granules in goblet cells of the Fu and De intestines (**p < .01, n = 7, scale bars = 1 μm). (C) Monocle 2 pseudotime analysis showing the developmental trajectory of goblet cells. (D) Dot plot showing the expression of CD44, CD55 and MXD1 in goblet, transit‐amplifying (TA) and stem cells. (E) Differences in pathway activities scored per cell using gene set variation analysis in goblet, TA and stem cells. Pathway scores were normalized. (F) Violin plots showing the oxidative phosphorylation and ATP metabolism scores of each subset of epithelial cells. (G) Gene set enrichment analysis showing enriched biological pathways in goblet cells of the Fu and De intestines (p < .05). (H) Alcian blue/periodic acid‐Schiff (AB–PAS) staining and immunostaining of CHGA, LYZ, OLFM4 and LGR5 in the Fu and De intestines (*p < .05, ns = not significant, n = 5, scale bars = 50 μm). (B and H) Paired Wilcoxon rank‐sum test. All values are presented as mean ± SEM of each group. NES, normalized enrichment score.
