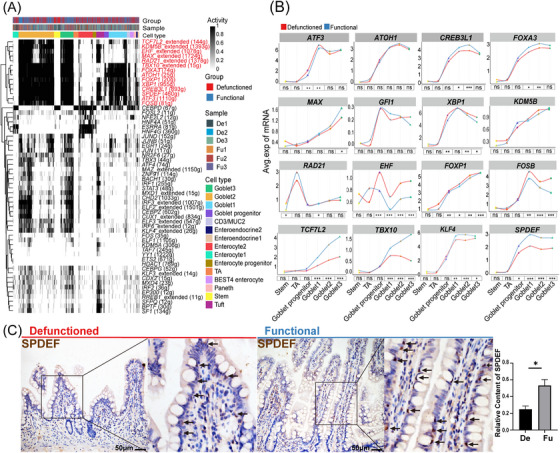
FIGURE 5.

Transcription factor analysis in intestinal goblet cells. (A) Heat map showing the regulon activity scored using the R package AUCell in epithelial cells. Each row represents a regulon, and each column represents a cell. (B) Expression of transcription factors enriched in goblet cells of the functional (Fu) and defunctioned (De) intestines along the developmental trajectory (*p < .05, **p < .01, ***p < .001, ns = not significant, Wilcoxon rank‐sum test). (C) Immunohistochemistry staining showing the expression of SPDEF in goblet cells of the Fu and De intestines (*p < .05, n = 5, scale bars = 50 μm, paired Wilcoxon rank‐sum test. The values are presented as mean ± SEM of each group).
