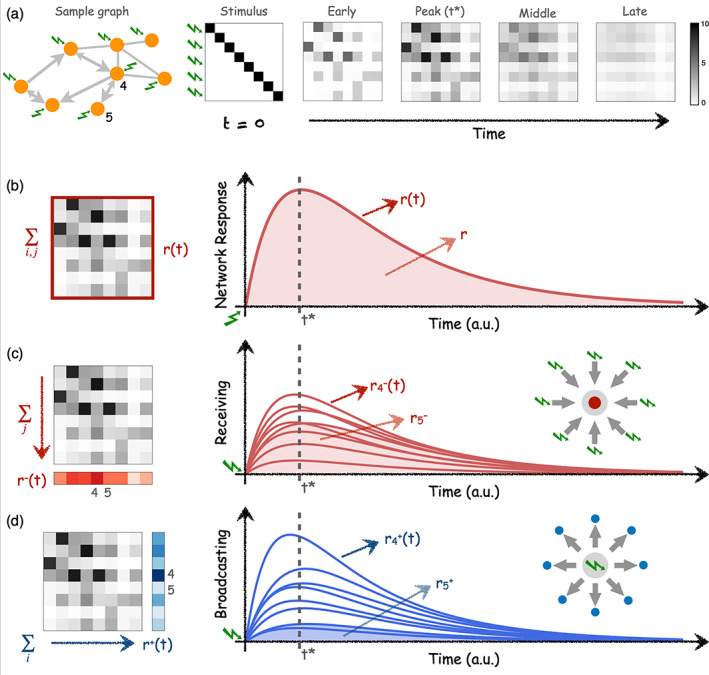
FIGURE 1.

Network analysis via simulation of perturbation‐responses. (a) Temporal evolution of pair‐wise responses to an initial unit perturbations at time applied at every node of a sample network. The network is directed and weighted, thus pair‐wise responses are asymmetrical. The subsequent analysis of responses can be performed at different levels. (b) The global network response is computed as the sum of all pair‐wise responses at each time t. Global network response rapidly peaks at time t* and slowly decays as a consequence of the leakage term in Equation (2) resembling a dissipation of signal at the brain regions. is thus the total accumulated response in the network and is calculated as the integral (area‐under‐the‐curve) of . (c) The ‘Receiving’ capacity is the temporal response of one node to all the inputs applied at . It is thus a signature of how much of the network flows centralise at a given node, which is a (necessary but not sufficient) condition of a node to integrate information. is calculated as the column‐sum of the response matrices . (d) The ‘Broadcasting’ capacity the nodes represent the influence that node i exerts over the network by quantifying the amount of response elicited over all the nodes by an input applied at node i. Thus, is calculated as the row‐sum of the response matrices . For illustration, the behaviour of two nodes, and are highlighted. Node 4 is a central and node 5 is a ‘leaf’ only connected to node 4. As a consequence, node 4 has the largest receiving and broadcasting capacities in the network. A strong connection 4 → 5 implies that node 5 is very much influenced by the network (large receiving) but a weak connection 5 → 4 results in that node 5 can barely influence the other nodes (low broadcasting).
