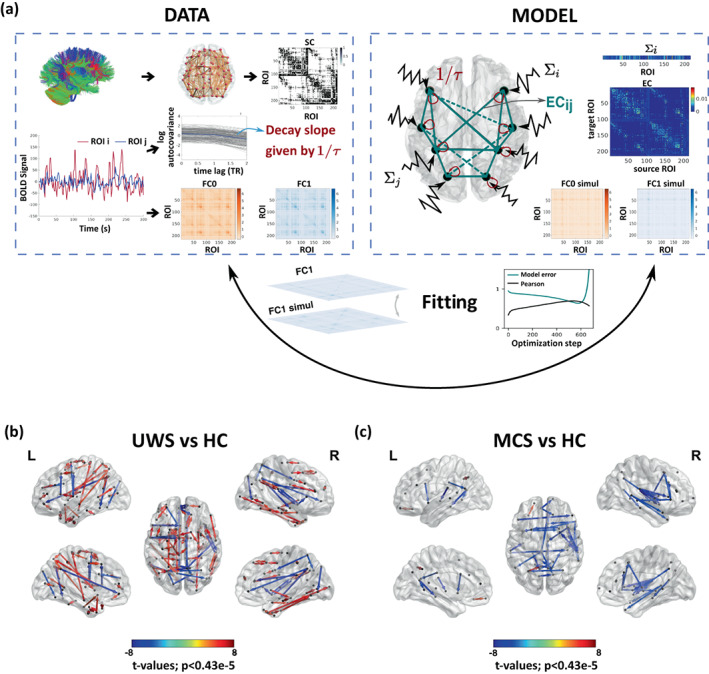
FIGURE 3.

Comparison of effective connectivity (EC) between healthy controls and patients. (a) Schematic representation of the fitting procedure leading to estimation of EC. Considering a model of noise diffusion—the multivariate Ornstein‐Uhlenbeck process—the whole‐brain network model is constrained using structural connectivity obtained from diffusion imaging and then fitted to reproduce the empirical resting‐state data. In particular, to fit the zero‐lag and 1TR‐lag covariance matrices and , and the regional noise level ∑i. (b, c) Maps of significantly different EC connections between patients and controls. UWS patients show connections with both decreased and increased EC (decreased in fronto‐temporal, frontal–parietal and midline regions; increased in subcortical and wide cortical areas). Blue and red arrows indicate lower and higher EC, respectively, in patients as compared to HC subjects. MCS patients show decreased EC in fronto‐temporal and interhemispheric midline connections. The directional connections in the glass brain represents connections with significant between‐group differences (Bonferroni corrected for 11,395 tests, p‐value < 0.05) are represented.
