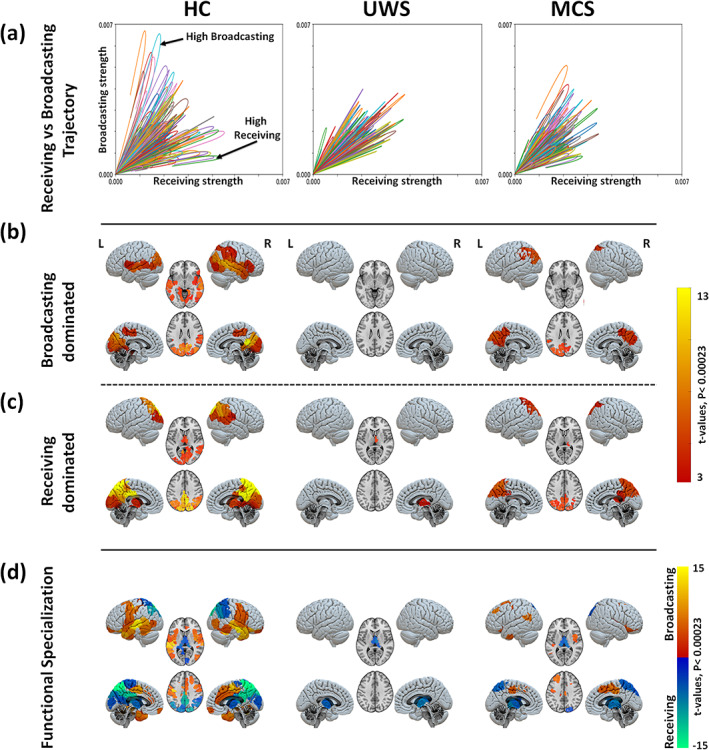
FIGURE 5.

Region‐wise broadcasting and receiving capacities due to exogenous perturbations. (a) Comparison between the temporal trajectories of the receiving and the broadcasting for different brain regions. Results for one sample participant shown in each panel. In healthy controls, an asymmetry between the receiving and broadcasting of several areas is observed suggesting a specialised functional role of those areas. This functional differentiation is lost in patients with UWS. Note that the end of the network response curve is cut at the end of the simulation time (200 s). Maps of significantly large broadcasting (b) and receiving capacities (c) for the three study groups (healthy controls, HC; unresponsive wakefulness syndrome, UWS; and minimally conscious state, MCS). The color code represents the t‐values. Only regions with significantly high values are presented in each case (Bonferroni corrected p‐values < 0.05 for 214 tests (brain regions). (d) Maps of regional specialization estimated as the difference between the broadcasting and the receiving capacities of each brain region.
