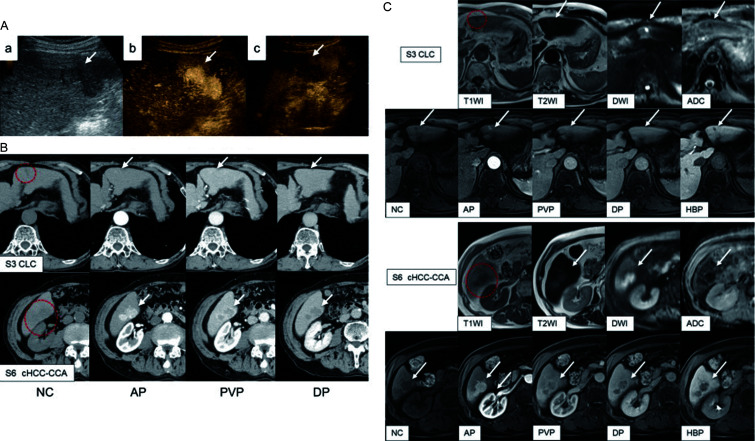
Fig. 1.
Imaging studies of the liver tumors. (A) Abdominal contrast-enhanced ultrasonography (CEUS) reveals the presence of a lobulated hypoechoic mass in the liver segment 6 (S6) with an approximate size of 40×20 mm (a). The segment 3 (S3) tumor could not be detected. The CEUS image reveals the tumor is homogeneous and hyperenhanced during the arterial phase (b) and hypoenhancing during the postvascular phase (c). (B) Abdominal contrast-enhanced computed tomography (CT) imaging of both tumors (red dotted circle and white arrows). The S3 tumor demonstrates slight hypoattenuation during the non-contrast (NC)-enhanced phase, partial hyperenhancement during the arterial phase (AP) up to the portal venous phase (PVP), and isoattenuation during the delayed phase (DP). The S6 tumor demonstrates hypoattenuation during the NC-enhanced phase, homogeneous hyperenhancement during the AP, peritumoral enhancement during the PVP, and washout during the DP. (C) Abdominal magnetic resonance imaging (MRI) findings of the two tumors (red dotted circle and white arrows). The S3 and S6 tumors demonstrate low signal intensity on T1-weighted MRI and sightly high intensity on T2-weighted MRI. Diffusion-weighted imaging (DWI) showed high intensity for both tumors. The apparent diffusion coefficient map created by conventional DWI showed the masses with decreased signal intensity, suggesting diffusion restriction of both tumors. These tumors showed hypointensity during the hepatobiliary phase. The S6 tumor demonstrated hyperintensity during the AP and peritumoral enhancement during the PVP. The S3 tumor demonstrated hyperintensity from the AP to the PVP.

