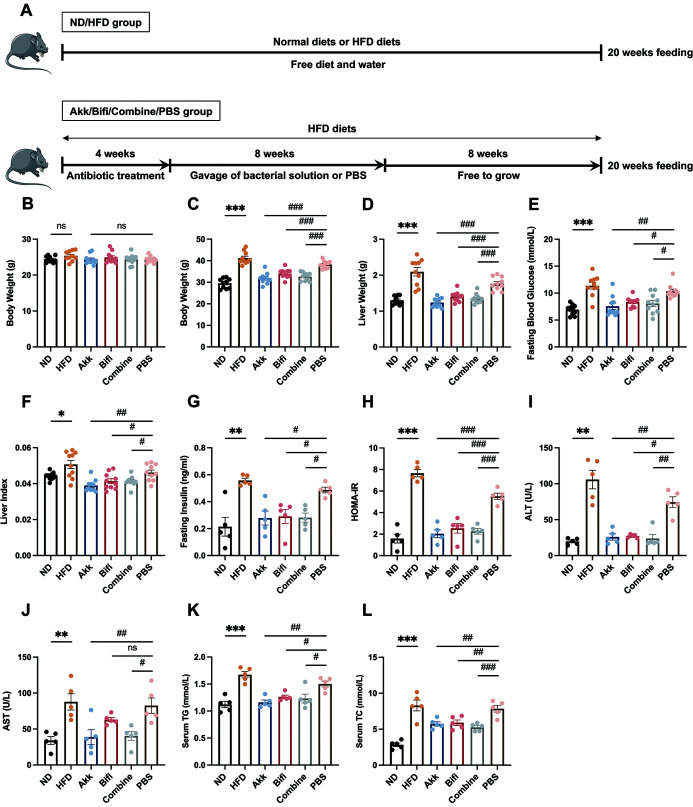
Fig. 1. Effect of administration of A. muciniphila or B. bifidum on glycolipid metabolism indicators.
(A) The animal procedure schematic diagram. (B) The body weight after quadruple antibiotics administration. (C) Final body weight of mice before sacrifice after 20 weeks of HFD feeding. (D) Liver weight. (E) Fasting blood glucose. (F) Calculated liver index. Liver index=liver weight/body weight. (G) Fasting insulin levels. (H) Calculated HOMA-IR. HOMA-IR=fasting blood glucose × fasting insulin /22.5. (I) Serum ALT levels. (J) Serum AST levels. (K) Serum TG levels. (L) Serum TC levels. Data were expressed as mean± SEM. N=10 per group in (B) (C) (D) (E) (F). N=5 per group in (G) (H) (I) (J) (K) (L). *p<0.05, **p<0.01, ***p<0.001 vs. ND group. #p<0.05, ##p<0.01, ###p<0.001 vs. PBS group. ALT, alanine aminotransferase; AST, aspartate aminotransferase; TC, total cholesterol; TG, triglycerides.

