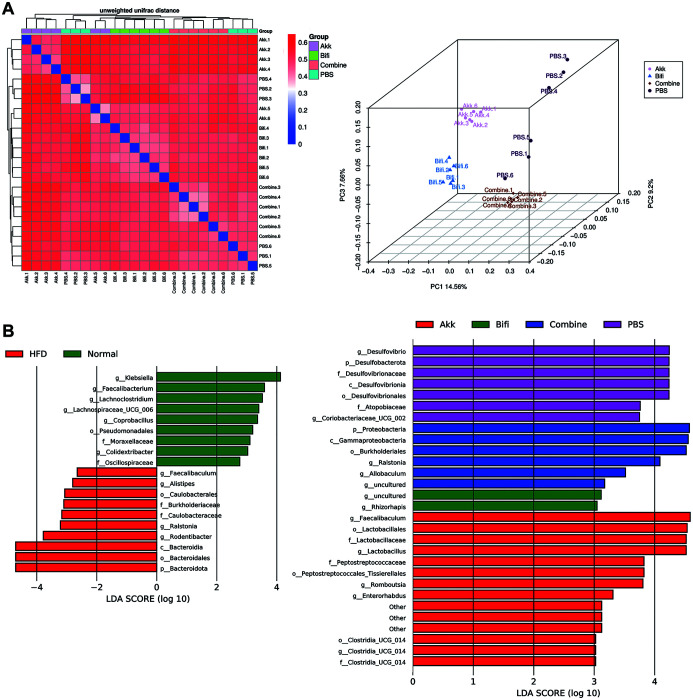
Fig. 6. Beta diversity of the gut microbiota and LEfSe plots.
(A) Comparison of beta diversity based on unweighted unifrac distance heatmap and PCoA plots in Akk group, Bifi group, Combine group, and PBS group. (B) LEfSe analysis plots between groups. N=6 per group. LDA, linear discriminant analysis; PCoA, principal coordinates analysis.

