
Fig. 2. Box plots of liver stiffness measurements (LSMs) according to liver fibrosis stage (A) and liver inflammation activity grade (B) in the cohort I.
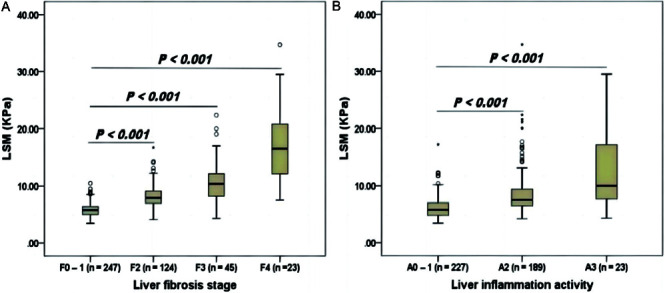
Upper and lower whiskers indicate the 75th percentile plus 1.5 interquartile range (IQR) and the 25th percentile minus 1.5 IQR, respectively. Outlier: a value greater than the 75th percentile plus 1.5 IQR.