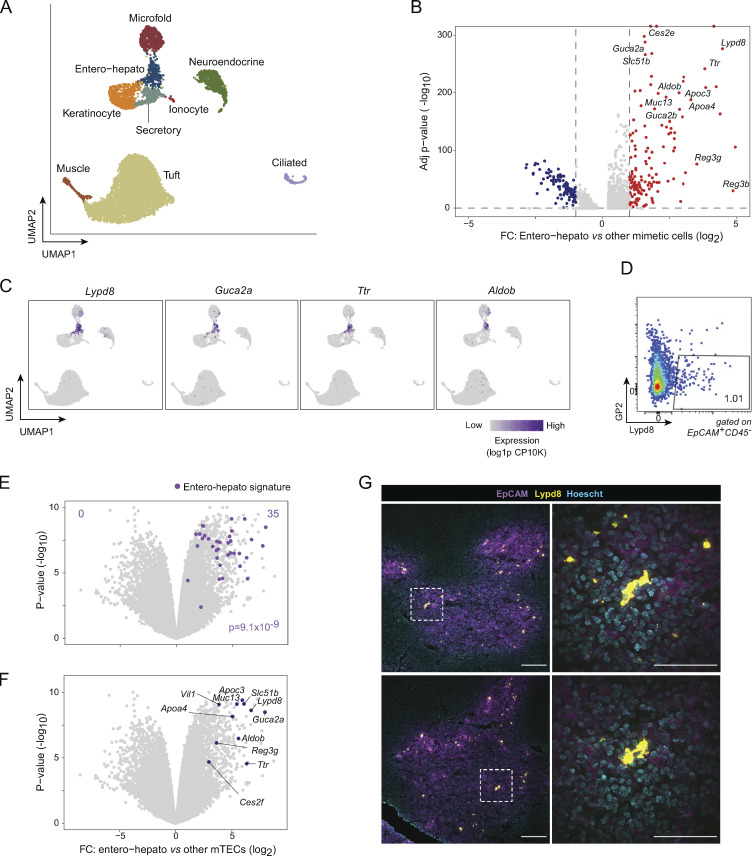
Figure 1.
Entero-hepato mTECs express gut and liver epithelial programs and are marked by Lypd8. (A) UMAP plot of scRNA-seq of mimetic cells, colored by mimetic cell cluster. Data were reanalyzed from Michelson et al. (2022b). For all UMAP plots, each dot represents a single cell. (B) Volcano plot of differentially expressed genes (highlighted red and blue, BH FDR <0.05) in entero-hepato mTECs vs. all other mimetic cells. For all volcano plots, each dot represents one gene. (C) UMAP plots as in A, colored by expression of the indicated transcripts. log1p CP10K, natural log1p of counts per 10,000 total counts. (D) Flow plot of entero-hepato mTECs (Lypd8+GP2−). (E) Volcano plot of bulk RNA-seq of entero-hepato mTECs (n = 3), gated as in D, versus other mTECs (Lypd8-GP2−; n = 3). The entero-hepato mTEC signature is overlaid in purple, and the P value was calculated by one-way Chi-squared test. (F) Data from E, with some entero-hepato marker genes labeled. (G) Immunofluorescence microscopy of thymic sections, stained for the indicated markers. Magnified views on the right are maximum intensity projections corresponding to boxed regions on the left. Scale bars, 100 μm (left) and 50 μm (right). For D and G, data are representative of at least two independent experiments.

