Figure 2.
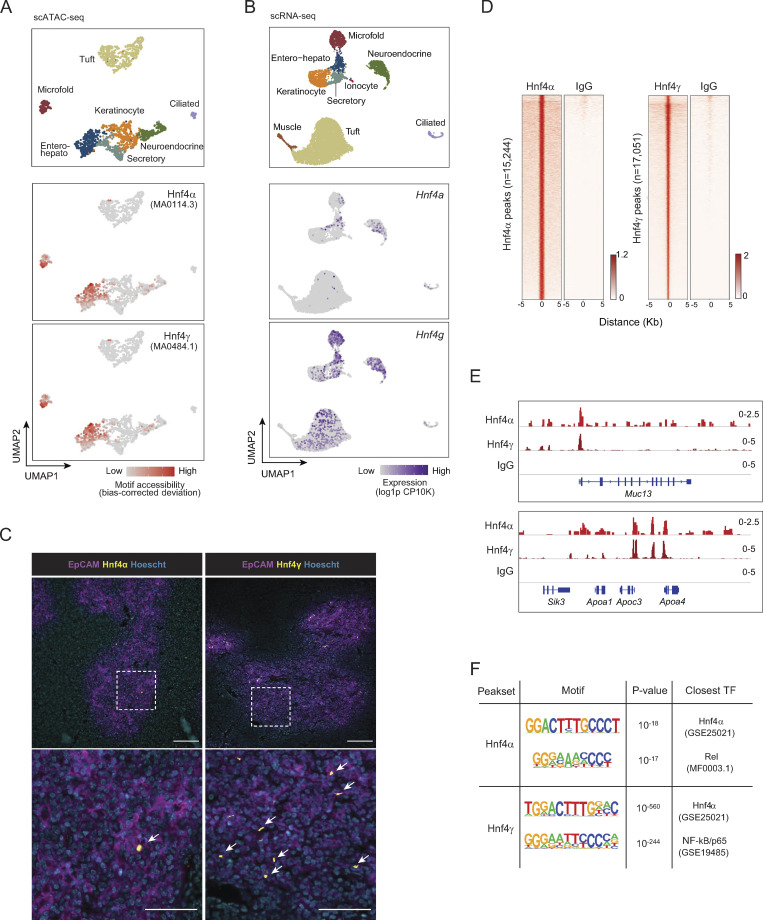
Hnf4 defines the chromatin program of entero-hepato mTECs. (A) UMAP plots of scATAC-seq of mimetic cells, reanalyzed from Michelson et al. (2022b). Cells are colored by mimetic cell type (top plot) or indicated motif accessibility (bottom two plots). (B) UMAP plots of scRNA-seq of mimetic cells, as in Fig. 1. Cells are colored by mimetic cell type (top plot) or indicated transcript expression (bottom two plots). (C) Immunofluorescence microscopy of thymic sections, stained for the indicated markers. Magnified views on the bottom are maximum intensity projections corresponding to boxed regions on the top. Scale bars, 100 μm (top) and 50 μm (bottom). Data are representative of at least two independent experiments. (D) Hnf4α and IgG CUT&Tag signal at Hnf4α peaks (left) and Hnf4γ and IgG CUT&Tag signal at Hnf4γ peaks (right) in purified mTECs. Signal is normalized as CPM. (E) Genome browser tracks of CUT&Tag of the indicated factors in mTECs at the indicated loci. Signal is in CPM. (F) De novo motifs (left) detected by HOMER within Hnf4α peaks (top) and Hnf4γ peaks (bottom), with corresponding P values for motif enrichment (center) and the name of the closest matched motif (right).

