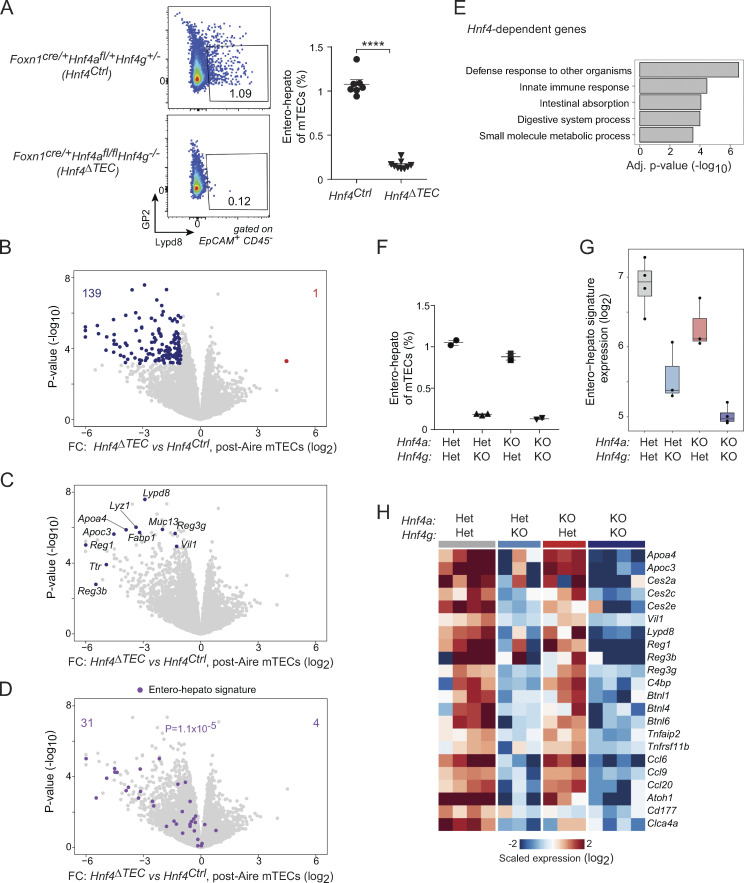
Figure 4.
Hnf4 is required for entero-hepato mTEC accumulation and PTA expression. (A) Representative flow plots (left) and summarized data (right) of the fraction of entero-hepato mTECs in thymi from Hnf4Ctrl (n = 7) versus Hnf4ΔTEC (n = 9) mice. For summarized data, each dot represents one mouse, bars represent mean ± SEM, data were pooled from three independent experiments, and P value was calculated by two-sided, unpaired Student’s t test. ****, P < 0.0001. (B–D) Volcano plots of bulk RNA-seq of post-Aire (Pdpn−CD104−) mTECs from Hnf4Ctrl (n = 4) versus Hnf4ΔTEC (n = 4) mice, colored by differentially expressed genes (top; BH FDR < 0.05), selected entero-hepato markers (middle), or the entero-hepato mTEC signature (bottom; P value calculated by one-way Chi-squared test). (E) Several top gene ontology terms among the transcripts significantly downregulated in post-Aire mTECs from Hnf4ΔTEC mice, as indicated in B. Enrichment was calculated using gProfiler. (F) Fractional abundance of entero-hepato mTECs in mice with the indicated genotypes. Each dot represents one mouse, bars represent mean ± SEM, and data for 4aHet4gHet and 4aKO4gKO mice were replotted from A. Data are representative of at least two independent experiments. (G) Mean expression of entero-hepato mTEC signature genes in bulk RNA-seq of post-Aire mTECs from 4aHet4gHet (n = 4), 4aHet4gKO (n = 3), 4aKO4gHet (n = 3), and 4aKO4gKO (n = 4) mice. For all boxplots, median and interquartile range (IQR) are shown as boxes and minimum and maximum values (up to ±1.5*IQR) as whiskers. (H) Heatmap of scaled expression of select entero-hepato mTEC marker genes in post-Aire mTECs from mice of the indicated genotypes. Each row is one gene, and each column is one biological replicate.

