Figure 6.
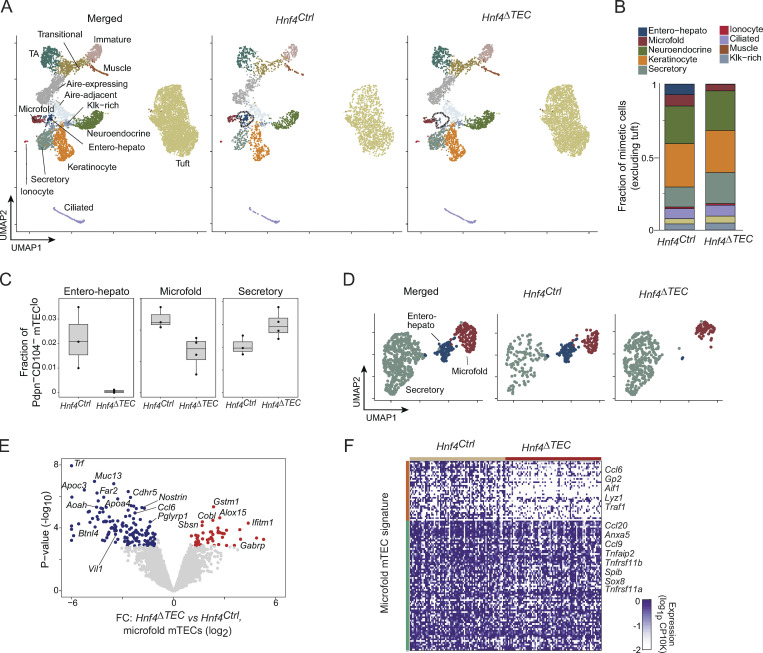
Three different effects of Hnf4 on mimetic cells. (A) UMAP plots of scRNA-seq of mimetic cells from Hnf4Ctrl (n = 3) and Hnf4ΔTEC (n = 4) mice, merged (left) or divided by genotype (center and right) and colored by cluster. (B) Stacked barplot indicating the mean fractional representation of each mimetic cell type in thymi from Hnf4Ctrl and Hnf4ΔTEC mice. Note that tuft mTECs, being disproportionately abundant, were excluded to allow for adequate visualization of other clusters. (C) Boxplots of fractional abundance of the indicated mimetic cell clusters among all post-Aire (Pdpn−CD104−) mTEC. Each dot represents one biological replicate. (D) Subclustered scRNA-seq UMAP plots of secretory, entero-hepato, and microfold mTECs from Hnf4Ctrl and Hnf4ΔTEC mice, merged (left) or divided by genotype (center and right) and colored by cluster. (E) Volcano plot of pseudobulked differential expression of microfold mTECs derived from Hnf4Ctrl and Hnf4ΔTEC mice. Differentially expressed genes (BH FDR < 0.05) are highlighted. (F) Heatmap of expression of microfold mTEC signature genes among microfold mTECs derived from Hnf4Ctrl and Hnf4ΔTEC mice. Each column is one cell, each row is one gene, cells are organized by genotype, and genes are k-means clustered (k = 2) with some representative genes for each cluster labeled.

