
Figure 3. Bronchopulmonary Dysplasia (BPD) and Moderate-to-Severe BPD.
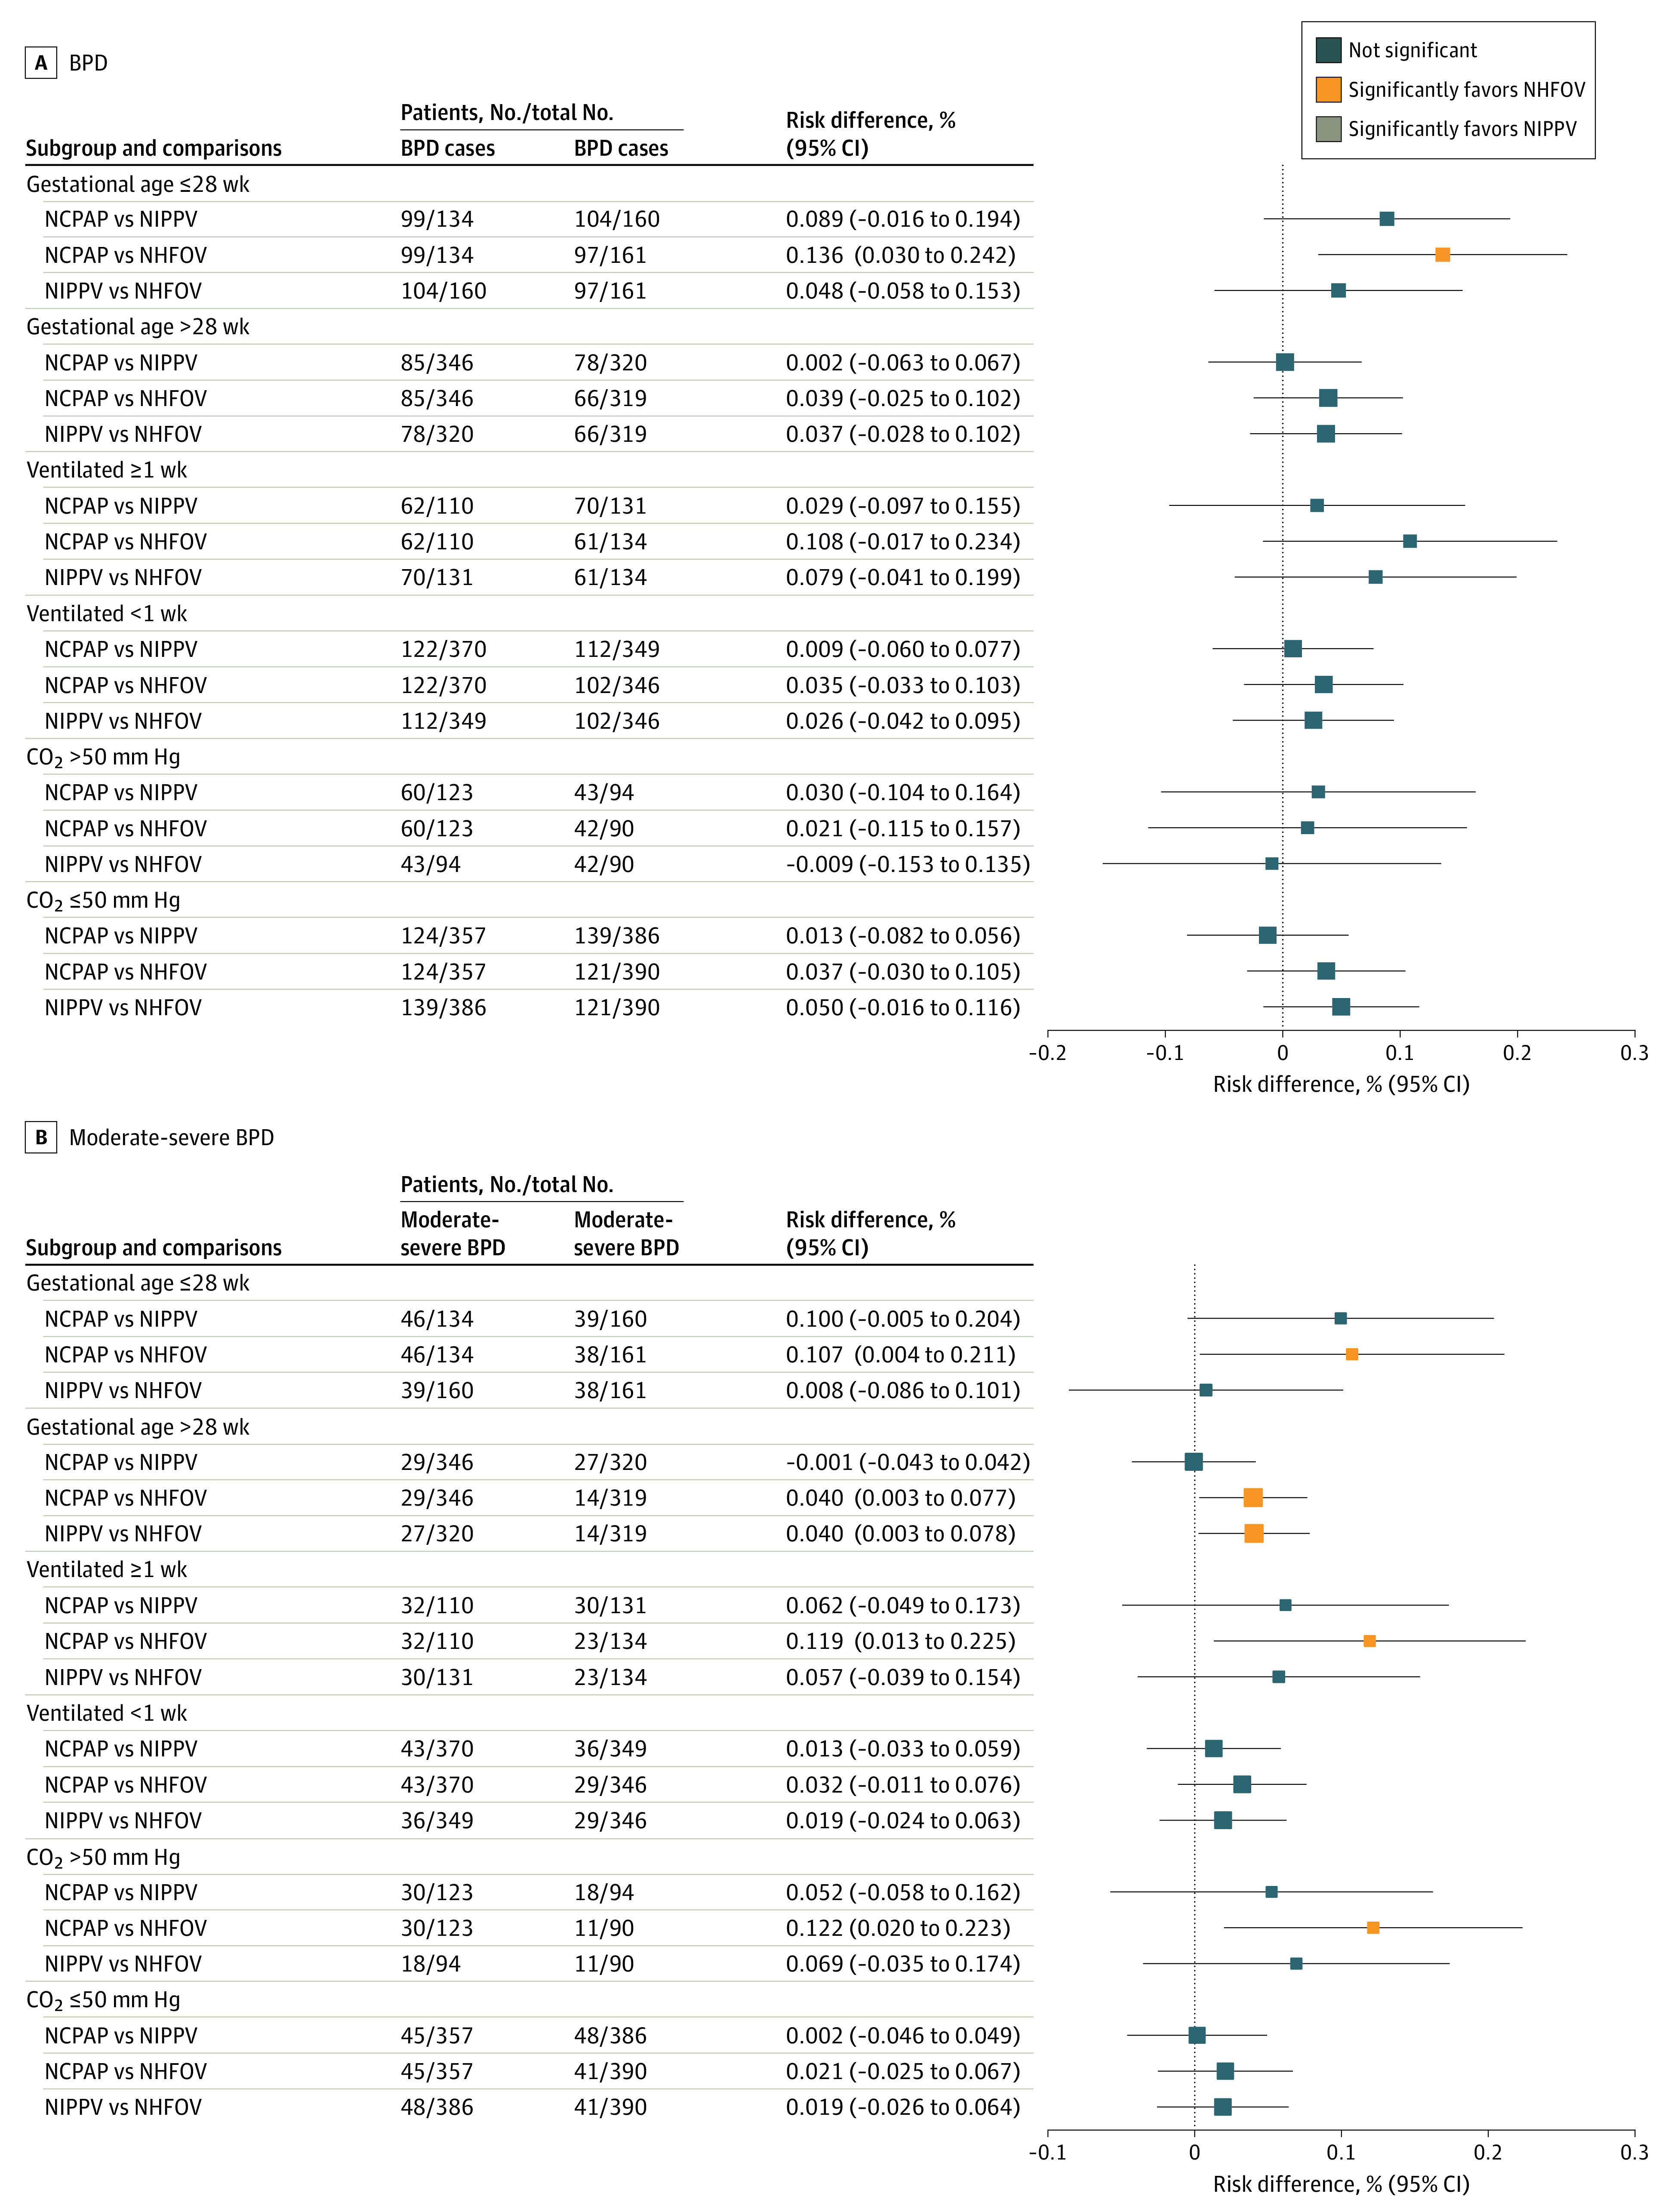
Squares and lines indicate the mean percentage risk differences and their 95% CI, respectively. Square size is proportional to the subgroup size. P values for all comparisons are shown in the eAppendix in Supplement 2. Results for the whole population have been published elsewhere.11