FIGURE 2.

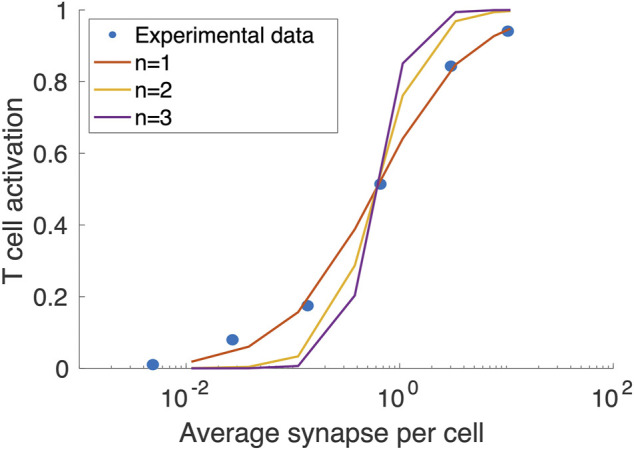
Fitting the Hill function coefficient (n) of T cell activation to concentration on synapse formed per T cells. The blue circles are extracted from (Vyver et al., 2021).

Fitting the Hill function coefficient (n) of T cell activation to concentration on synapse formed per T cells. The blue circles are extracted from (Vyver et al., 2021).