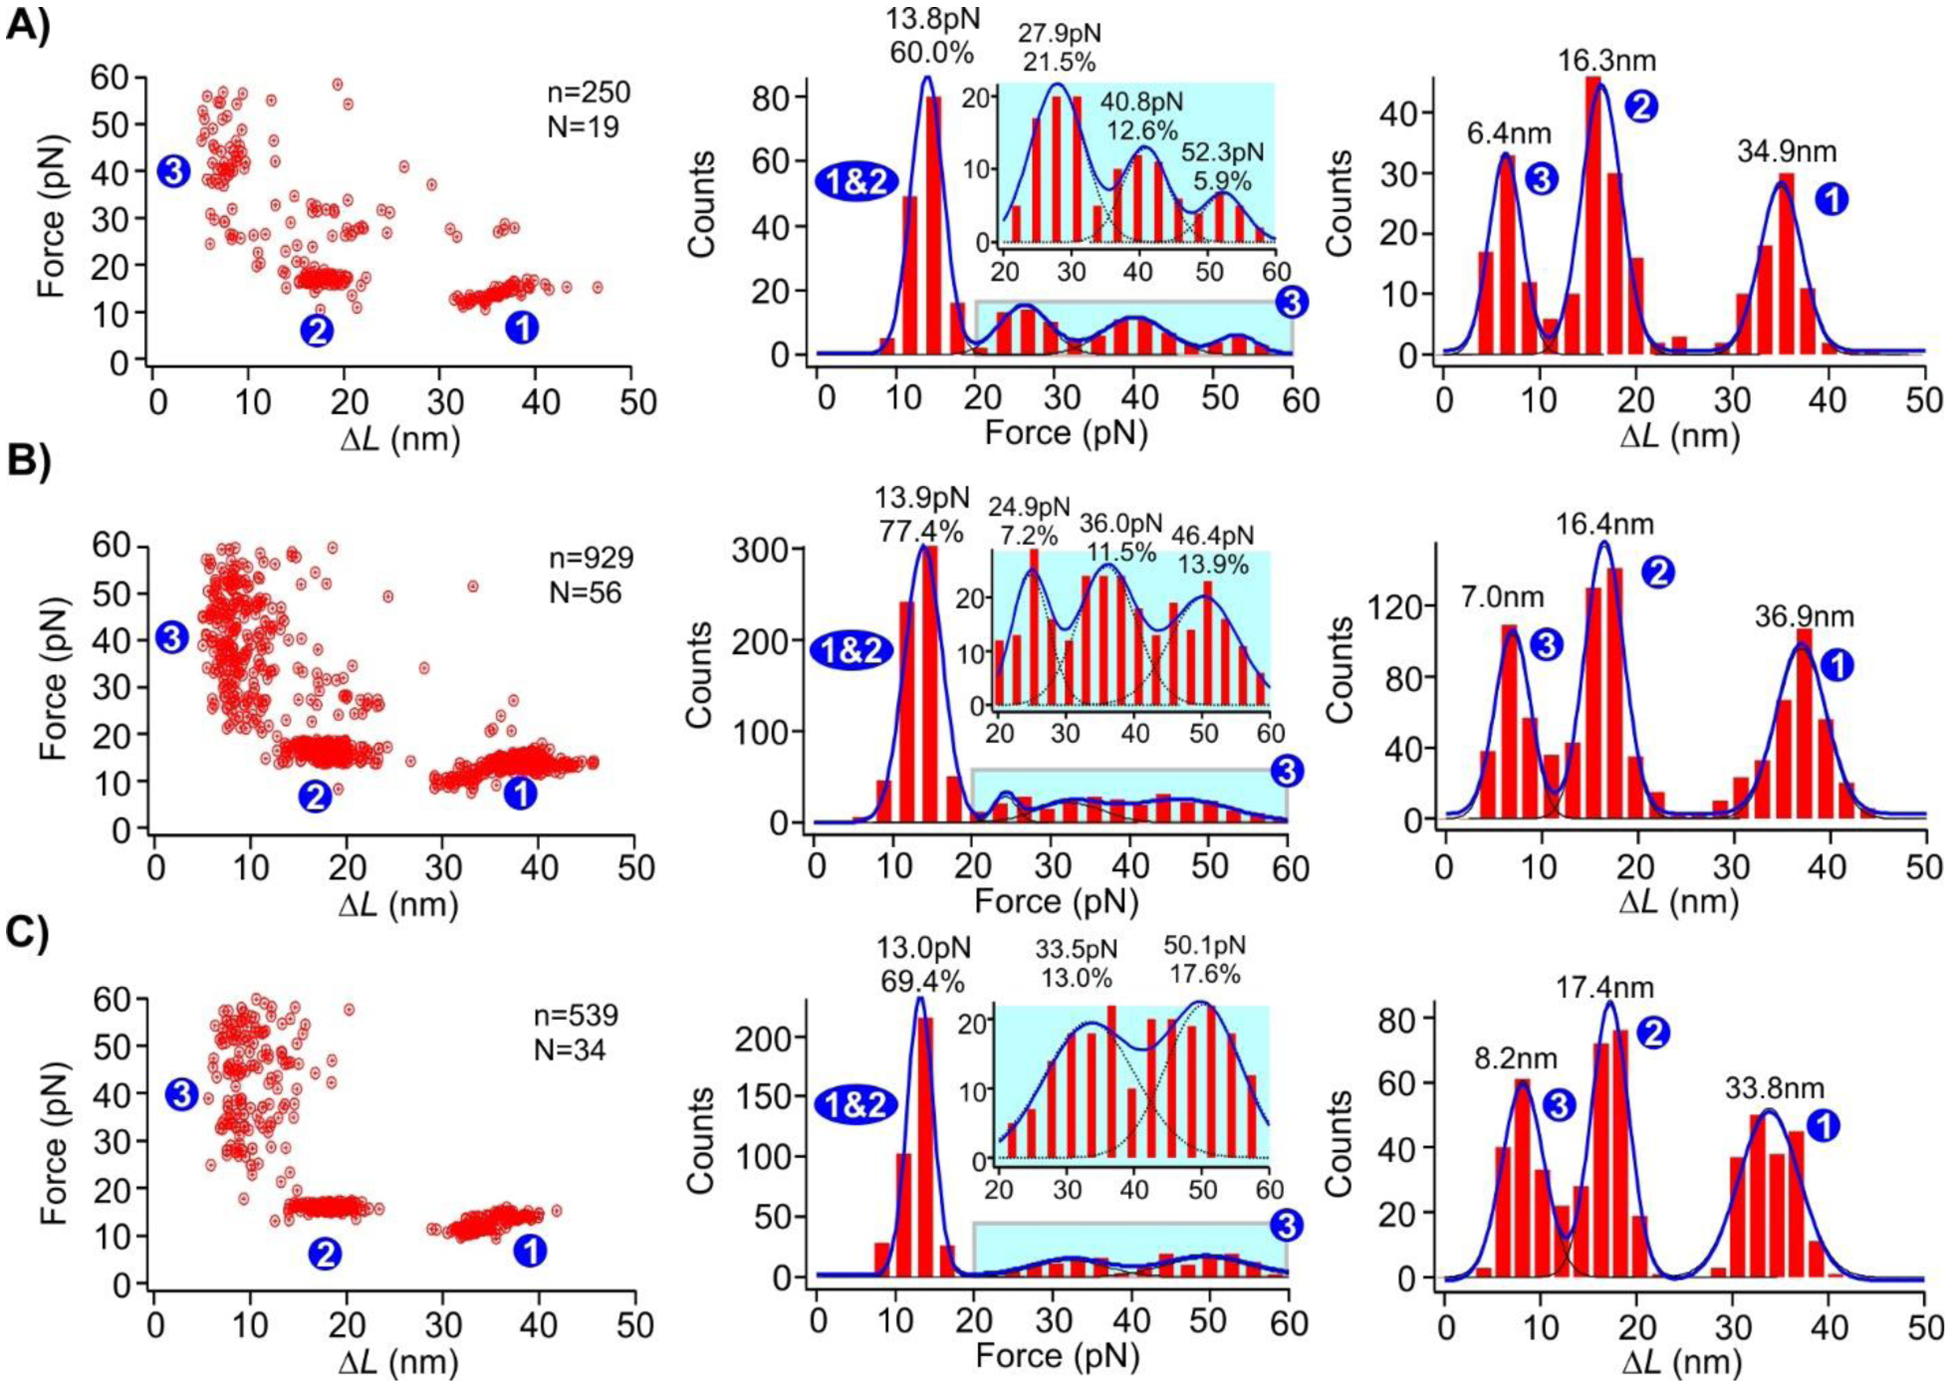
Figure 5.

Force vs ΔL plot (left), unfolding force histograms (middle), and ΔL (right) histograms of the (dA)21 containing DNA constructs in the presence of AuNPs with diameters of A) 1.8 nm, B) 5.0 nm, and C) 10.0 nm. Dotted curves in the blown-up insets in the unfolding force histograms represent the gaussian fits for individual populations. Solid curves are Gaussian fittings for overall populations. N represents the number of molecules from which the FX curves were collected, and n represents the total number of unfolding features measured.
