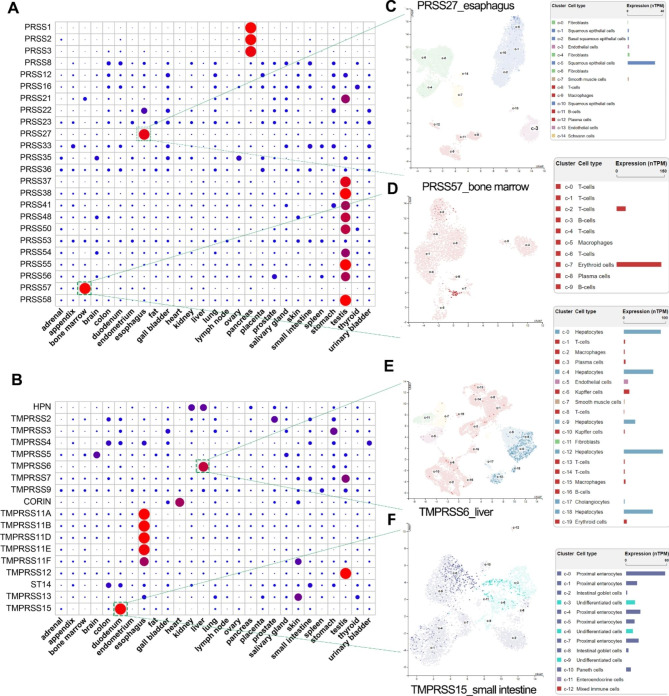
Fig. 1.
The expression pattern of 42 serine protease in human tissues. (A and B) The tissue-specific expression analysis of 24 PRSS genes and 18 TMPRSS genes. The expression data (RPKM value) of 42 serine proteases in various human tissues was available from the HPA project using the NCBI website. The dot plot is generated using relative expression value of each serine protease. In short, the relative expression value of each gene was obtained by making the sum of the RPKM value of each gene in all tissues be 1. (C-F) Single-cell analysis revealed the distinct cell types of the tissue-specific serine proteases, including PRSS27, PRSS57, TMPRSS6 and TMPRSS15. All single-cell plots here were screenshots from the HPA database

